Did you know that your ODS style might result in changing the color ramp for contour plots and heat maps? For example, the default style in SAS 9.3 is HTMLBlue. Let's create a contour plot in the HTML destination by running an example adapted from the documentation for the RSREG procedure:
/* From RSREG Getting Started documentation */ data smell; input Odor T R H @@; datalines; 66 40 .3 4 39 120 .3 4 43 40 .7 4 49 120 .7 4 58 40 .5 2 17 120 .5 2 -5 40 .5 6 -40 120 .5 6 65 80 .3 2 7 80 .7 2 43 80 .3 6 -22 80 .7 6 -31 80 .5 4 -35 80 .5 4 -26 80 .5 4 ; ods graphics on; ods html style=htmlblue; proc rsreg data=smell plots=surface; model Odor = T R; ods select Contour; run; |
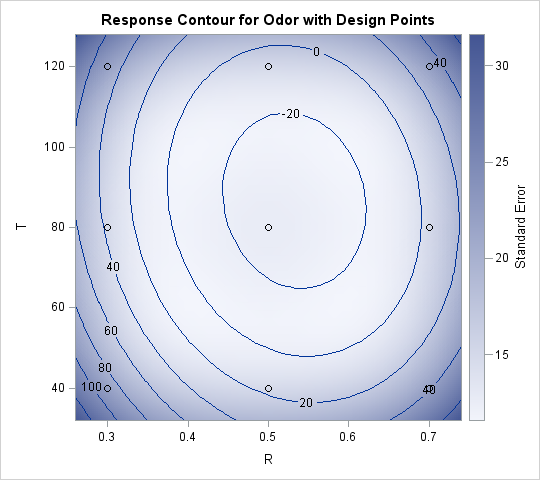
The procedure creates a contour plot of the predicted response surface. The background of the plot is colored according to the standard error of the response. Notice from the color ramp on the right side that light colors represent small standard errors, whereas dark colors represent larger errors.
Sometimes I use the ODS journal style when I am writing a paper or book that will be published in grayscale rather than color. Let's create the exact same contour plot by using the journal style:
ods html style=Journal; proc rsreg data=smell plots=surface; model Odor = T R; ods select Contour; run; |
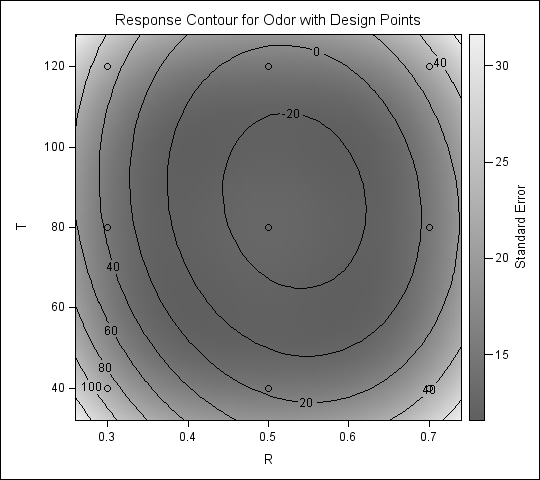
The plot looks very different, even though it conveys exactly the same information. In this plot, the color ramp on the right side of the plot has opposite "polarity": dark colors represent small standard errors, whereas light colors represent larger errors.
Typically, a report uses a single style. Consequently, your color ramps will be consistent throughout the report. However, be careful if you publish an article that displays the procedure syntax and asserts that "dark regions represent areas with large standard errors." Those words might not be true if your reader is running a different ODS style than you are.
How to reverse a color ramp in SAS ODS graphics
Incidentally, if you like everything about an ODS style except for the color ramp that is used for contour plots, you can use PROC TEMPLATE to define a new template. The new template can inherit from a standard template, but redefine the color ramp.
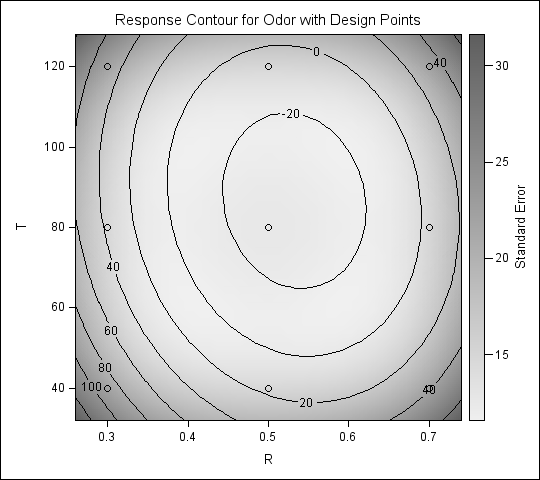
For example, the following statements define a style called JournalReverse that inherits from the Journal style. In the JournalReverse style, the 'start' and 'end' colors of the two-color color ramp are chosen so that light colors correspond to low values and dark colors correspond to large values. The result is a grayscale image that looks similar to the HTMLBlue image at the beginning of this article.
proc template; define style styles.JournalReverse; parent=styles.Journal; class graphColors from graphColors / 'gramp2cend' = cx5F5F5F 'gramp2cstart' = cxF0F0F0; end; run; ods html style=JournalReverse; proc rsreg data=smell plots=surface; model Odor = T R; ods select Contour; run; |
For more ways to modify existing ODS styles, or to learn how to write your own style, see the "Style" chapter in the SAS/STAT User's Guide
