Don’t worry! This is not an excerpt from a romantic love letter. The title of this blog post is an allusion to my talk on "Missing Values", at the A2013 conference in June in London.
There is not much time for emotions: dealing with missing values in analysis is not a romantic game but an inevitable reality for many statisticians and data miners. Thus, there is a reason to give this issue appropriate attention. In this post I want to share exclusively with you some of my thoughts about missing values and provide a taste of my A2013 presentation.
It is important to be clear: Missing values and missing values are not always the same (this must be the first time in statistics that there is general recipe for something). A close look at the properties of missing values is absolutely necessary to have the right recipes on hand to detect and treat missing values.
How do I know that something is missing?
This question may sound trivial. A missing value in a table can be recognized by the fact that in a cell is not filled in but is empty! In fact, there are many examples of such explicit missing values. A field is left blank because the date of birth is unknown. Or a customer refuses the answer and no value is entered in the field "number of children." Such cases can be easily detected and selected by database queries.
But not all missing values reveal themselves in such a simple way. The analysis of the number of machine downtimes in a factory results in the following: three events in April, four in May, two in July. From a pure technical point of view no values are missing and the "number of failures" is always filled. However, from a content point of view we indeed have missing data: there is no entry for June. It now has to be decided whether this means that in June there were no failures or if no information exists for June.
We must check the analysis to see where data points are missing (where the time series has “holes”) and how these holes shall be interpreted from a business point of view. In the example above with monthly data on failures we discover the gap because we know the calendar and know that after May must be June. However, if we want to analyze which and how many products an insurance customer has, and the data from one contract system (e.g. health insurance) is not provided, the situation is different. We then have missing information that cannot be made visible in a simple way. In this case, a data review with a business expert is very important.
Are simple frequencies really sufficient?
Missing values are often described by calculating the relative frequency of missing values for a certain feature in relation to the total number of observations. This can result in the following statistics: 12% of the income value are missing, 8% of the age value are missing, and 4% of the cases for modification date are missing.
Thus we can illustrate which characteristics are most commonly infected by the "missing value disease" in our data. However, what we don’t see from this analysis is how many records have no missing value for any of the characteristics. But the so called number of "full-records", is for many statistical analyses, an important parameter. In the above example, this may be 88% of the rows, if the values of age and modification date are only designated missing if the income value is also missing. However, it can also be only 76% of the rows, if the missing values are distributed.
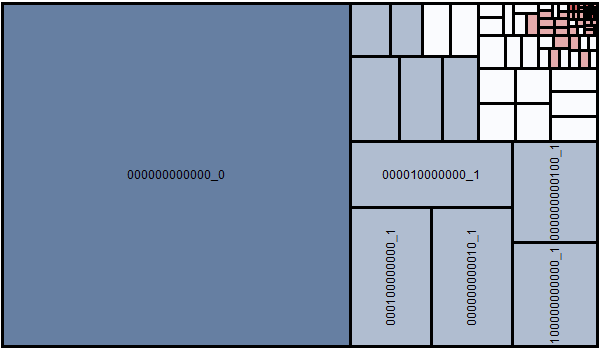
A common method that is used to detect the structure of the missing values is to analyze the "missing value patterns" in the form of tile charts. Here it can be seen at one glance that about 60% of the records don’t have a single missing value (pattern 000000000000), and that another 30% of the records have a missing value in only one feature (light blue). The little red cells show groups of records where five or more features are missing. This information is important to decide whether missing values shall be imputed by analytical methods.
Just a coincidence?
The purely quantitative analysis of missing values still does not give a complete picture. Moreover, analysis and decisions on the random or systematic occurrence are crucial.
Missing age data, which occurs randomly for 20% of customers, represents a loss of information and creates a degree of uncertainty in our data. However, we can assume that although our view is more fuzzy this occurs for all segments, regions, … in the same frequency and our sight is not biased by the missing values.
In contrast, consider the case when missing values occur for those customers who have had a long customer relationship with our company. Perhaps new customers were not previously asked for the date of birth. In this scenario we must be aware that "age unknown" not only correlates with the duration of the customer relationship but also with the age itself (which for older clients is more often missing) and potentially with other characteristics (e.g. region, product type, ...). This fact must be considered in the analysis and the interpretation of the results as well.
For these cases, powerful analytics combined with expert understanding provide methods for the detection and treatment of systematic missing values that go much beyond the simple "I-insert-the-mean-for-missing-values" method and provide a better basis for analysis.
Interested?
If I have gotten your attention, I would be pleased to meet you at my upcoming presentations. On June 12th I will be at the SAS Data Mining User Day in Heidelberg and on June 19th and 20th at the A2013 conference in London. If that's too long to wait, you can "pre-read" my new book Data Quality for Analytics Using SAS.