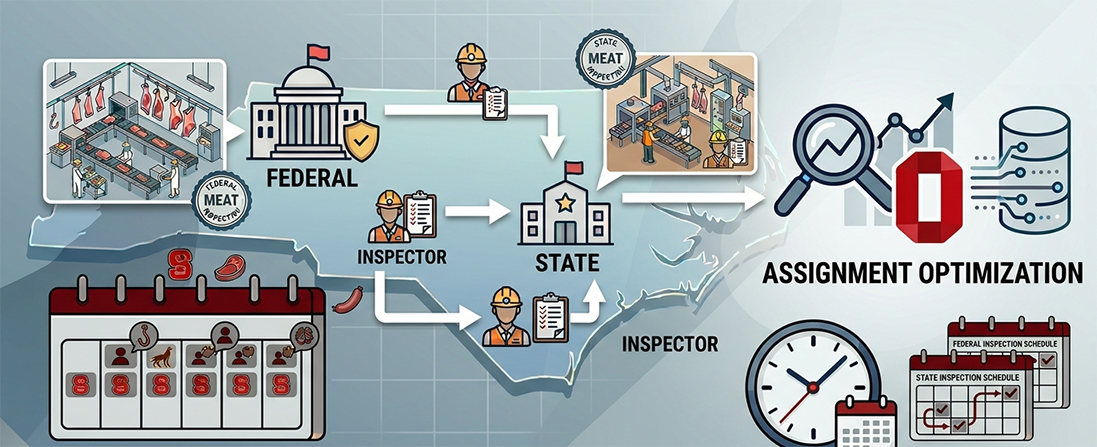
Batch manufacturing involves producing goods in batches rather than in a continuous stream. This approach is common in industries such as pharmaceuticals, chemicals, and materials processing, where precise control over the production process is essential to ensure product quality and consistency. One critical aspect of batch manufacturing is the need to manage and understand inherent time delays that occur at various stages of the process.
Uncategorized
A SAS programmer wanted to visualize density estimate for some univariate data. The data had several groups, so he wanted to create a panel of density estimate, which you can easily do by using PROC SGPANEL in SAS. However, the programmer's boss wanted to see filled density estimates, such as
Generative AI (GenAI) is in its most popular era and many organisations across industry are looking for ways to unlock its potential value. McKinsey's projections suggest that GenAI could add a staggering $2.6 to $4.4 trillion in value to the global economy. In fact, banking is the number one industry
After writing a program that simulates data, it is important to check that the statistical properties of the simulated (synthetic) data match the properties of the model. As a first step, you can generate a large random sample from the model distribution and compare the sample statistics to the expected
桜が散ったと思うと、いつの間にかツツジの季節がやってきた。ツツジは、4月中旬から5月中旬にかけて咲く、日本で最も親しまれている植物の一つであり、桜の散る頃から北海道から沖縄まで全国各地の様々な場所で楽しめる花でもある。歴史的には、徳川家のツツジ好きもあって江戸幕府が植栽に力を入れ、大名たちの間で庭園づくりブームが起きたとか。 さて、統計学のコースだが、多くの良質な書籍やコンテンツがあり、感心するものも多いが、しかし、入門としては物足りなさを否めない。特に、「社会人のための・・・」をうたったコースにおいては、統計学を長年体系的に勉強した者として、大学(統計学部)の授業のようなものが多く一般人にはレベルが高い印象を受ける。また、日本独自の事情やニーズに合った教材が必要ではないかと思う。 前述したツツジのように統計学が日本中に広まってほしい、データリテラシーの底上げに貢献したいという気持ちから、「統計学入門」コースを新設した。このコースは、統計の勉強をしたことがない社会人向けに分かりやすく統計の基礎を解説し、かつ実務へのつながりを意識した質問、例を盛り込むことで、統計学の概念の定着につながるように構成している。実務に統計学がどのように活用されているのかなどをより意識したコース内容となっている。また、本コースはSAS製品を使用していない方でも受講可能である。この機会にぜひ受講を検討いただきたい。 2024年5月初旬 相吉
A SAS programmer was trying to implement an algorithm in PROC IML in SAS based on some R code he had seen on the internet. The R code used the rank() and order() functions. This led the programmer to ask, "What is the different between the rank and the order?
As a child therapist, and as a parent, I believe in the power of bibliotherapy. Reading about worries, social challenges, and big life changes is one of the most effective strategies to help your child learn about and cope with their feelings. May is Mental Health Awareness Month and reading
A SAS statistical programmer recently asked a theoretical question about statistics. "I've read that 'p-values are uniformly distributed under the null hypothesis,'" he began, "but what does that mean in practice? Is it important?" I think data simulation is a great way to discuss the conditions for which p-values are
At a recent conference in Las Vegas, a presenter simulated the sum of two dice and used it to simulate the game of craps. I write a lot of simulations, so I'd like to discuss two related topics: How to simulate the sum of two dice in SAS. This is
When we think of something “new”, we tend to picture something clean, shiny, or efficient. The new normal of fraud only checks one of those boxes, and unfortunately, that’s “efficient.” Today, scams and cyber attacks are persistent, and part of a larger ecosystem of phishing and hacking attacks by both
Years ago, I wrote an article that showed how to visualize patterns of missing data. During a recent data visualization talk, I discussed the program, which used a small number of SAS IML statements. An audience member asked whether it is possible to construct the same visualization by using only
An uncertain global economic climate has created a sense of unease and a heightened risk when managing finances for individuals and banking and financial institutions. Helping banks and financial institutions manage risk is a central pillar of how SAS adds value for our customers, who must ensure their organization is
SAS' Federica Citterio answers the perennial data science question: "How can I trust (generative) LLM to provide a reliable, non-hallucinated result?"
A SAS programmer wanted to estimate a proportion and a confidence interval (CI), but didn't know which SAS procedure to call. He knows a formula for the CI from an elementary statistics textbook. If x is the observed count of events in a random sample of size n, then the
In a recent article, I graphed the PDF of a few Beta distributions that had a variety of skewness and kurtosis values. I thought that I had chosen the parameter values to represent a wide variety of Beta shapes. However, I was surprised to see that the distributions were all
Thanks to the ubiquity of smartphones and laptops, people are used to getting what they need at the press of a button – whether they’re looking for information, seeking action or trying to solve a problem. Citizens want that same ease of access from their city’s government. As more citizens
The moment-ratio diagram is a tool that is useful when choosing a distribution that models a sample of univariate data. As I show in my book (Simulating Data with SAS, Wicklin, 2013), you first plot the skewness and kurtosis of the sample on the moment-ratio diagram to see what common
In a world where MarTech complexity is skyrocketing, utilization has declined sharply and the integration of data and technology are a marketer’s biggest tech challenges, CMOs are under pressure to prove marketing ROI. However, the combination of SAS and the Snowflake Data Cloud presents a value proposition that is hard
A SAS programmer wanted to simulate samples from a family of Beta(a,b) distributions for a simulation study. (Recall that a Beta random variable is bounded with values in the range [0,1].) She wanted to choose the parameters such that the skewness and kurtosis of the distributions varied over range of
A dot plot is a standard statistical graphic that displays a statistic (often a mean) and the uncertainty of the statistic for one or more groups. Statisticians and data scientists use it in the analysis of group data. In late 2023, I started noticing headlines about "dot plots" in the
Authors: Steven Harenberg and Amy Becker The total solar eclipse taking place across a thin band of the United States on April 8, 2024, is going to be a stellar event. In this post, we will help plan a journey to see the total solar eclipse. We will use algorithms
SAS Viya can allow users and organizations to more easily interface with the LLM application, build better prompts and evaluate systematically which of these prompts leads to the best responses to ensure the best outcomes.
My colleague Rick Wicklin maintains a nifty chart that shows the timeline of SAS releases since Version 8. A few of you asked if I could post a similar chart for SAS Enterprise Guide. Here it is. Like Rick, I used new features in SAS 9.4 to produce this chart
SAS' Varun Valsaraj demonstrates how to build a digital assistant for a warehouse space optimization use case.
Recently, I saw a scatter plot that displayed the ticks, values, and labels for a vertical axis on the right side of a graph. In the SGPLOT procedure in SAS, you can use the Y2AXIS option to move an axis on the right side of a graph. Similarly, you can
Adopting analytics and AI in the public sector is changing how governments make decisions. Technology improves the efficiency and transparency of work processes, positively impacting service delivery to increasingly demanding citizens. However, many government organizations still need help fully embracing a data-driven culture. The Covid-19 pandemic is one of the
A recent article describes how to estimate coefficients in a simple linear regression model by using maximum likelihood estimation (MLE). One of the nice properties of an MLE formulation is that you can compare a large model with a nested submodel in a natural way. For example, if you can
SAS announces continued support and releases for SAS 9 and a new role for SAS Enterprise Guide with SAS Viya.
Concerns about risk and the fear of change can be some of the biggest barriers to career development. Following the release of her book Leap: Why It’s Time to Let Go To Get Ahead in Your Career, author Jessica Galica invites you to reframe your view on risk. Speaking for
1. ‘SAS 컨테이너 런타임’이란? SAS는 SAS Viya 2021.1.1.3에서 SAS 컨테이너 런타임(SAS Container Runtime, 이하 SCR)을 출시했으며, 그 이후 많은 고객이 운영환경에서 SCR을 구현했습니다. 이 혁신적인 런타임 엔진은 SAS 모델과 의사결정을 Open Container Initiative (OCI) 호환 컨테이너에 배포하는 역할을 합니다. SCR은 표준 기술을 사용하여 SAS Viya 외부에서 모델과 의사결정을 실행합니다. 클라우드