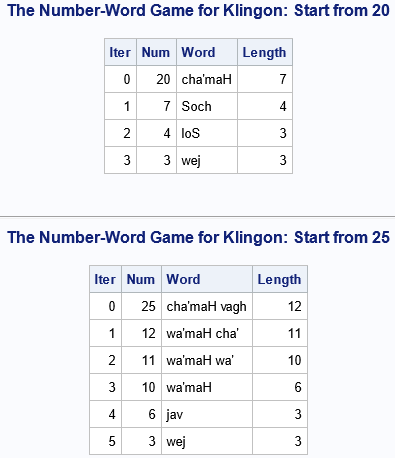
When I was growing up, our family had a bookcase containing a set of encyclopedias - it was where I went to obtain information and facts about various things, to satisfy my curiosity and impress my friends. Now that we have the Internet, Wikipedia has taken the place of encyclopedias
Uncategorized
2017年12月にSAS Viyaの最新版3.3がリリースされました。 これに伴い、皆様には、大幅に拡張されたSAS Viyaの機能を存分に体感いただくために今版から、皆様がお持ちの「実データ」でSAS Viyaベースのすべての製品を自由に触っていただけるようになりました。 ぜひ、ご利用ください! 利用手順に関しては、以下のブログをご覧ください。 SAS Viyaを体感してみよう! ~SAS Viya無償試用版利用ガイド~
¿El departamento de Tecnología de la Información (TI) de su empresa se puede considerar moderno? ¿Su labor se limita a mantener las cosas funcionando o es visto como un área de innovación real? Y en el caso de su líder, el director de TI (CIO), ¿qué papel está desempeñando para
56777906 - plan of soccer manager pointing to strategy tactical board A la industria de los juegos de azar y las apuestas les llegó el momento de empezar a usar el análisis de data y la estadística predictiva para ser más acertados a la hora de determinar la manera y
Behavioral health information technology (HIT) adoption efforts have struggled and are still plagued by a number of challenges. Since 2011, the federal government has incentivized the industry to the tune of $37 billion. However, according to US Senator Sheldon Whitehouse (D-RI) “psychologists, community mental health centers, psychiatric hospitals, and others
Regulierung, Kostendruck und technologische Weiterentwicklung – ist abwarten und Tee trinken die bessere Strategie für die Banken, als die Ärmel hochzukrempeln und loszulegen, nur, weil die Regulierung mal wieder hustet? Wie gehen Institute mit den immerwährenden neuen Regulierungen um? Wie sieht es in der Praxis aus, sind Basel, IFRS oder
US health care costs are the highest in the developed world, despite per-capita healthcare spending roughly double that of the others, but with outcomes worse-or-equal-to comparable countries. A 2014 Commonwealth Fund study ranked the United States 11th out of 11 major industrial nations in overall healthcare. An aging population is
I previously showed an easy way to visualize a regression model that has several continuous explanatory variables: use the SLICEFIT option in the EFFECTPLOT statement in SAS to create a sliced fit plot. The EFFECTPLOT statement is directly supported by the syntax of the GENMOD, LOGISTIC, and ORTHOREG procedures in
포브스(Forbes) 글로벌 500대 기업 경영진의 대부분은 ‘경험’을 차세대 경쟁 요소로 꼽았습니다. 왜 그럴까요? 오늘날 디지털 중심의 옴니채널 세계에서 고객은 정보와 밀접하게 연결되어 있고, 정보를 적극적으로 이용하고 있으며, 그 이용 방법 또한 점점 더 정교해지고 있습니다. IT 분야의 세계적인 석학이자 MIT 미디어 연구소 설립자인 니콜라스 네그로폰테(Nicholas Negroponte)가 1998년에 발표한 성명에 단어 하나만
What's stopping you from being a data-driven business? Phil Simon points to four common stumbling blocks.
SAS' tag line is The Power to Know©, But what makes SAS so powerful? Ask our users and they'll tell you -- it's because SAS allows them to answer questions which previously could not be answered. How does SAS do this? SAS built a 4th generation programming language which makes
Vivian Jones quien es Country Manager de SAS para Colombia y Ecuador, habló con el periódico La República, uno de los diarios de negocios en el país, sobre el foco estratégico de la compañía para el próximo año, el cual estará dirigido a profundizar en el sector financiero con nuevas soluciones relacionadas
Without a prepared and available workforce, a community, county or state will slowly decline and ultimately die. Why? Lacking a skilled workforce, a company cannot grow and compete. And if a company can’t grow and compete, it leaves, and the community suffers. Ever hear someone say, “I can’t find a
Most of us put on a few pounds over the holidays. It's difficult not to, with the holiday dinners, and then all the special desserts, snacks, and candies. But there might also be another source of extra calories that you hadn't thought about - fast-food! Let's have a look at
You never saw it coming. No indicators of attack on your financial data. Then, you get a letter. Your financial information was exposed in a massive data breach. What do you do now? Your identity is forever at risk. Unfortunately, you can't change where you used to live, when you last
We have updated our software for improved interpretability since this post was written. For the latest on this topic, read our new series on model-agnostic interpretability. As machine learning takes its place in many recent advances in science and technology, the interpretability of machine learning models grows in importance. We
Slice, slice, baby! You've got to slice, slice, baby! When you fit a regression model that has multiple explanatory variables, it is a challenge to effectively visualize the predicted values. This article describes how to visualize the regression model by slicing the explanatory variables. In SAS, you can use the
With the Christmas holiday approaching, I got to wondering what they call Santa in other countries. Of course, some countries don't celebrate Christmas - but most countries at least have some sort of "winter holiday," and most also have some tradition of gift-giving. So, I guess the better question might
What is blockchain and how can you analyze data in a blockchain? This article will discuss various forms of blockchain analytics from a tactical or heuristic perspective.
In meinen ersten drei Blogs (1/2/3)habe ich Ihnen eine Bauanleitung vorgestellt, mit der Sie Edge Analytics in einen Modell-Truck im Maßstab 1:14 montieren können. Das schien wie eine Spielerei, hat aber sehr reale Anwendungsszenarien. Heute, in Teil 4, möchte ich Sie zu einer eleganten Rolle rückwärts einladen! Will sagen: Die
The paradigm in which we have all lived in an electrified world is changing. The convergence of technology, changing business models, and increasing customer expectations means the way utilities have operated for the last 100+ years must change. Further, this change must embrace where the operations side of the business
Data with a geographic component begs to be mapped. That capability is now available to all SAS users. A new mapping procedure in the fifth maintenance release of 9.4 (SAS 9.4M5) allows any user to easily plot data on a map. Unlike previous mapping applications with SAS, the SGMAP procedure
블록체인, 전 세계를 뒤흔들다 최근 전 세계를 분 단위로 뒤흔들며 폭발적인 관심을 끌고 있는 화젯거리가 있습니다. 바로 비트코인(bitcoin)을 필두로 급팽창 중인 가상 화폐(virtual currency) 시장입니다. 이달 초 미국에서는 비트코인을 구매하기 위해 모기지(주택담보대출)를 빌리는 등 극단적인 투기 양상까지 나타나며 논란을 일으키기도 했는데요. 그 가운데 산업별 전문가들은 가상 화폐의 기반 기술인 블록체인(blockchain)에 주목하고 있습니다. ‘제 2의
I was recently reading the Wikipedia page about the U.S. presidents. There was a table with a lot of interesting data, but I thought it would be much easier to get a handle on the information if there was also a timeline graph. So, of course, I set out to
Meetup ist ein Online-Social-Networking-Service mit einem kleinen Unterschied zu Facebook, Instagram, LinkedIn & Co. Das Format ist dazu gedacht, Face-to-Face-Treffen zu interessanten Themen zu organisieren. Die Offline-Welt ist also ein elementarer Bestandteil. Selbstorganisiert und thematisch vielfältig Gruppen gibt es zu fast jedem Thema: Bücherclubs, Socialising, R-Nutzer, Unternehmer oder künstliche Intelligenz
Jim Harris says a data-driven business can make decisions faster, using better data, with more transparency about results.
Liebe und Mathematik: Auf den ersten Blick gibt es wohl keine zwei Welten, die weiter voneinander entfernt sind. Hannah Fry hat auf der Analytics Experience in Amsterdam das Gegenteil bewiesen: Mathematik kann das Geheimnis einer glücklichen Partnerschaft aufdecken und sogar eine Scheidung vorhersagen. Im Gespräch geht die Dozentin für „Mathematics
SAS Viyaがリニューアルされまして、ついにディープラーニングが登場しました! SAS ViyaのディープラーニングではオーソドックスなDeep Neural Network(DNN)から、画像認識で使われるConvolutional Neural Network(CNN、畳込みニューラルネットワーク)、連続値や自然言語処理で使われるRecurrent Neural Network(RNN、再帰的ニューラルネットワーク)まで利用可能になります。 ディープラーニングを使うことのメリットは、従来の機械学習やニューラルネットワークが苦手としている画像や文章を認識し、高い精度で分類や推論することが可能になります。 高い精度というのは、ディープラーニングのモデルによっては人間の目よりも正確に画像を分類することができるということです。 例えばコモンドールという犬種がありますが、この犬はモップのような毛並みをしていて、人間ではモップと見間違えることがあります。 これは犬? それともモップ? こういう人間だと見分けにくい画像に対しても、ディープラーニングであれば、人間よりも正確に犬かモップかを見分けることができるようになります。 というわけで、今回はSAS Viyaのディープラーニングを使って画像分類をしてみたいと思います。 ディープラーニングの仕組み 画像分類のディープラーニングではCNNを使います。 CNNは画像の特徴を探し出す特徴抽出層と特徴から画像を分類する判定層で構成されています。 特徴抽出層は主に畳込み層とプーリング層で構成されています。 畳込み層で入力画像に対し、ピクセルの特徴(横線の有無とか斜め線とか)を探し出し、プーリング層で重要なピクセルを残す、という役割分担です。 判定層は、特徴抽出層が見つけた特徴をもとに、画像の種類を分類します。 例えば犬と猫の分類であれば、特徴抽出層が入力画像から、面長で大きな鼻の特徴を見つけだし、犬と分類します。 または、丸っこい顔立ちと立った耳の特徴を見つけだし、猫と分類します。 SAS Viyaで画像を扱う SAS ViyaディープラーニングでCifar10をネタに画像分類をしてみたいと思います。 Cifar10は無償で公開されている画像分類のデータセットで、10種類の色付き画像60,000枚で構成されています。 各画像サイズは32×32で、色はRGBです。 10種類というのは飛行機(airplane)、自動車(automobile)、鳥(bird)、猫(cat)、鹿(deer)、犬(dog)、蛙(frog)、馬(horse)、船(ship)、トラック(truck)で、それぞれ6,000枚ずつ用意されています。 画像は総数60,000枚のうち、50,000枚がトレーニング用、10,000枚がテスト用です。 画像データは以下から入手することができます。 https://www.cs.toronto.edu/~kriz/cifar.html さて、Cifar10を使って画像分類をしてみます。言語はPython3を使います。 SAS Viyaで画像分類をする場合、まずは入手したデータをCASにアップロードする必要があります。 CASはCloud Analytics Servicesの略称で、インメモリの分散分析基盤であり、SAS Viyaの脳みそにあたる部分です。 SAS Viyaの分析は、ディープラーニング含めてすべてCASで処理されます。 CASではImage型のデータを扱うことができます。 Image型とは読んで字のごとくで、画像を画像フォーマットそのままのバイナリで扱えるということです。
No cabe duda que la tecnología Blockchain está llamada a ser una de las grandes revoluciones en el mundo en los próximos años. Se ha llegado a afirmar que hará por las transacciones lo que internet ha hecho por la información y las comunicaciones; va a cambiar definitivamente la forma
The SAS language is large. Even after 20+ years of using SAS, there are many features that I have never used. Recently it became necessary for me to learn about DICTIONARY tables in PROC SQL (and the associated SASHELP views) because I needed to programmatically obtain the text for the