All Posts


지난 7월 17일, 세계 이모티콘의 날을 맞아 애플, 유튜브, 페이스북 등 글로벌 기업들은 새로운 이모티콘을 공개하고 관련 설문조사 결과를 발표하는 등 다양한 이벤트를 진행했는데요. 많은 사람들이 습관처럼 사용하는 이모티콘은 온라인 비주얼 커뮤니케이션이라는 새로운 트렌드의 핵심 요소로 자리잡았습니다. 온라인, 특히 모바일에서 빠르고 명확하게 표현을 전달해야 할 때 이모티콘은 전 세계 누구와도

I started my computer career as a Unix system administrator, and when I began using SAS almost 30 years ago it was only natural that I used it on Unix computers (they were the most powerful/capable computers I had access to at the time). I've picked up a lot of


If you need more than just well-mixed data, take a look at data preparation from SAS.


When you use a regression procedure in SAS that supports variable selection (GLMSELECT or QUANTSELECT), did you know that the procedures automatically produce a macro variable that contains the names of the selected variables? This article provides examples and details. A previous article provides an overview of the 'SELECT' procedures


La aserción de que los datos son nuevos para el cobra y, en especial, un nuevo escenario para el negocio y en el que la economía digital es imparable. Las organizaciones de todo el mundo están cada vez más conscientes de ello y están aprovechando al máximo las innovaciones tecnológicas


このブログでは、SAS Viyaで提供される各種機能やリソースへのアクセス制限を設定する方法を紹介します。 ユーザーやグループが行うことができる(あるいは参照することができる)内容はルールによって設定されます。ルールは以下の権限要素によって構成されています。: ・プリンシパル:ユーザーまたはグループ。 ・ターゲット:サービス、フォルダ、レポートなどのリソース。 ・権限:アクセスのタイプ(たとえば、読み取りまたは書き込み)。 ・設定:アクセスが提供されているかどうかの表示、たとえば許可または禁止。 ルールのターゲットは、uniform resource identifier(uri)を使用して識別されます。URIは、フォルダやレポート、データプランなどのコンテンツ、またはデータのインポートなどの各種の機能などを表すことができます。 SAS Viyaでのuriの例をいくつか紹介します。 ・データプラン:/ dataPreparationPlans / plans / 810e2c6b-4733-4d53-94fd-dfeb4df0de9e ・フォルダ:/ folders / folders / e28e35af-2673-4fc7-81fa-1a074f4c0de9 ・機能性:/ SASVisualAnalytics / ** 以下の例では、「レポート開発者」カスタムグループを作成し、そのグループのユーザーのみがSAS Visual Analyticsでレポートを作成することができるように設定しています。 カスタムグループを作成します。 ルールを使用して、そのグループに使用機能に対する権限を設定します。 1. カスタムグループを作成 SAS Viyaの環境の管理(SAS Environment Manager)上で、管理者(管理者のみがユーザーとグループを管理できます)が、ユーザー>カスタムグループ>カスタムグループの新規作成を選択します。 カスタムグループの新規作成画面で、「名前」にグループ名、「ID」に一意のID、「説明」に必要に応じて説明を記載します。 新しいグループが作成されたら、編集ボタンをクリックして、新しいメンバーをグループに追加します。 ユーザーまたは他のグループを新しいグループのメンバーとして追加することができます。 2.ルールを使用して、そのグループに使用機能に対する権限を設定 「レポート開発者」グループのみがSAS Visual Analyticsの機能にアクセスできるようにルールを作成、または更新します。まず、SAS Visual Analyticsに現在適用されているルールを見ていきます。 環境の管理(SAS Environment
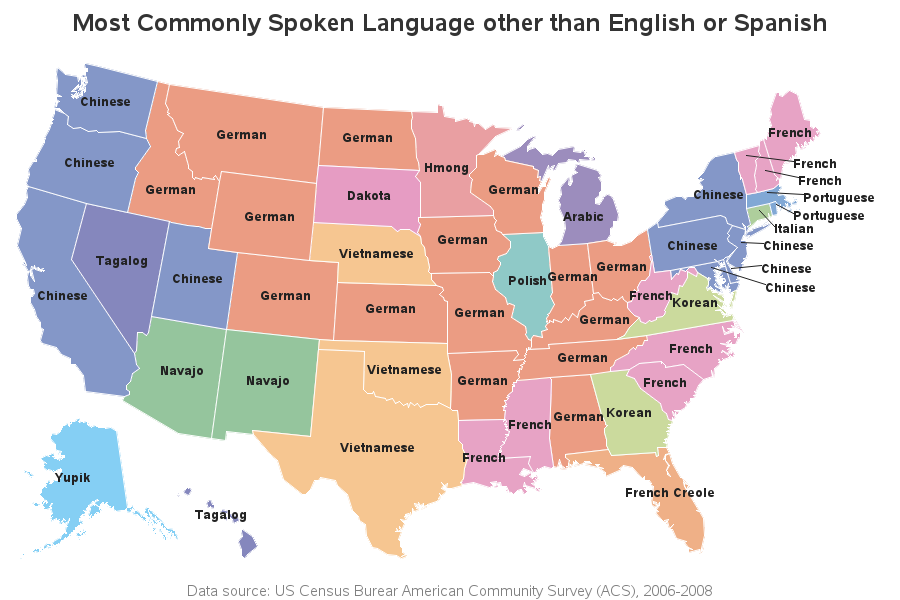
I can recognize several languages when I hear people speaking them (mostly because I lived in the Alexander International Dorm at NC State University). Therefore when I found a map of the most common languages spoken in each US state, it caught my attention, and I decided to try creating my
A programmer recently asked a question on a SAS discussion forum about design matrices for categorical variables. He had generated a design matrix by using PROC GLMMOD and wanted to use the design columns in a subsequent procedure. However, the columns were named COL1, COL2, COL3,..., so he couldn't tell

머신러닝 모델 해석력 시리즈 3탄! 오늘은 머신러닝 모델의 작동 원리에 대한 인사이트를 도출할 수 있는 변수를 표시하는 두 가지 방법에 대해 자세히 살펴보고자 합니다. 머신러닝 모델 해석력 시리즈 1탄과 2탄을 놓치셨다면, 클릭해주세요! 1탄: 인공지능(AI)과 머신러닝을 신뢰하기 위한 필수 조건, 해석력! 2탄: 머신러닝 해석력 시리즈 2탄: 데이터 세트를 이해하고 해석하는 방법 데이터 과학자가 모델이


@philsimon chimes in about how success in one area can lead to success in another.

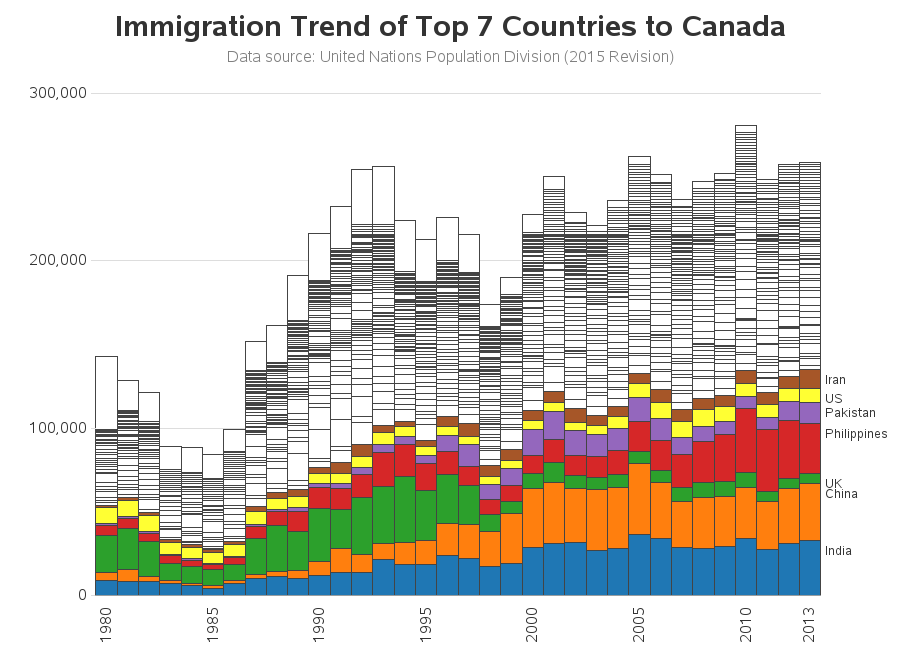
As you might have guessed from some of my previous blog posts, I'm an avid paddler. I like to paddle boats, and I like to try to go fast! And when I'm considering buying a new boat, it's only natural that I would analyze the data to make an informed


Cuentan que, en un aeropuerto, un grupo de titiriteros llevaba a sus muñecos en el equipaje de mano. Después de que el bolso pasó por el scanner, uno de ellos vio con desesperación que un funcionario uniformado intentaba entender con movimientos bruscos el contenido de aquel bolso. Rápidamente gritó “¡no
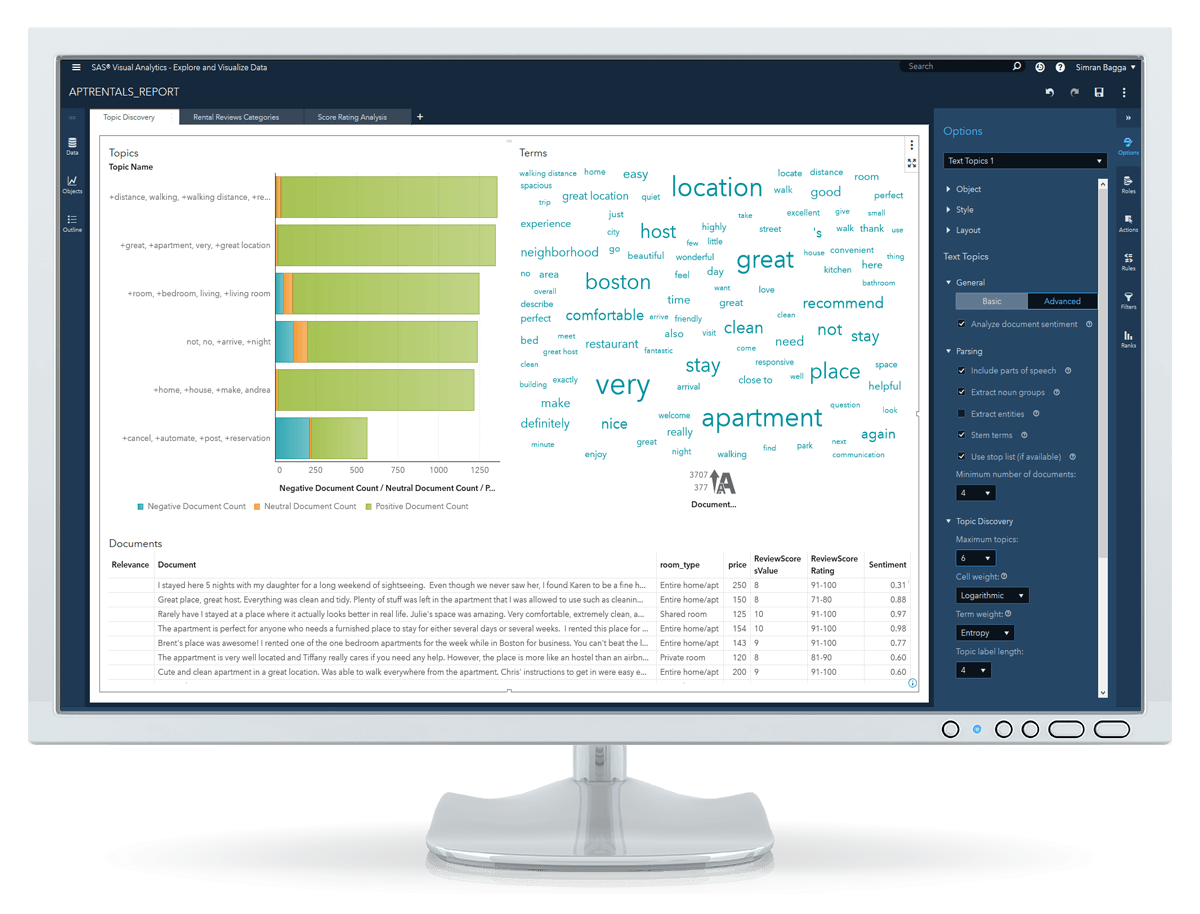

SAS Visual Analytics includes text parsing actions that can help tokenize sentences, and SAS Visual Text Analytics provides even better, more sophisticated methods. This article contains code samples and cites papers for more details.


Las empresas minoristas quieren vender; de eso se trata su negocio. Implementan mecanismos y estrategias para lograrlo y así atraer a un número mayor de clientes, tener precios competitivos y elevar su rentabilidad, ofrecer los productos que los consumidores quieren y ganarse su lealtad y estar en el top of
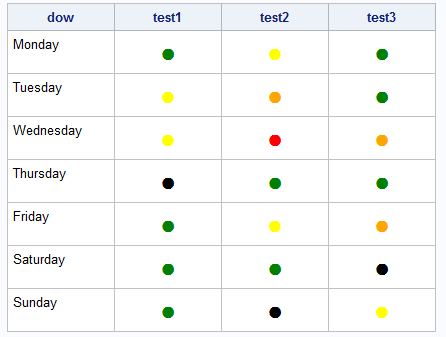

You should play a little. Add dots. Add color. Your PROC REPORT output does not have to be boring. As a matter of fact, it can be both functional and appealing. Any Unicode value will do, but this blog shows how to use the Unicode value for a dot (filled