All Posts

The ODS Graphics software, first released with SAS 9.2, supported creating graphs directly from statistical procedures. Prior to this, very few statistical procedures created graphs on their own, and in most cases creating graphs was a post process or creating the graphs from the saved data using SAS/GRAPH procedures. With


A pocos días de que Andrés Manuel López Obrador (AMLO) asumiera formalmente la presidencia de México, su administración envió a la Cámara de Diputados su propuesta de Egresos de la Federación para 2019, la cual asciende a $5.6 billones de pesos, 321 millones más de la correspondiente a 2018, cuando


Today's guest blog is the second of two on the topic of helping an older parent downsize and relocate. The author, Jennie Alwood, is the owner of Here2Home, a senior move management company in the Triangle area. In Part 1 we looked at getting our minds around the

Good news -- the SAS program that you wrote and put into production 10 years ago still works. Hey, it's SAS, so you probably take that for granted. But are those techniques from 2008 still the best way to accomplish your task? SAS 9.4, first released in 2013 and now

Across the business world, software as a service (SaaS) has redefined the way that people think about licencing software. In the past, licencing enterprise software was a major undertaking, but now the time-to-value has dropped from months to days. The trade-off is that organizations that buy SaaS will get an
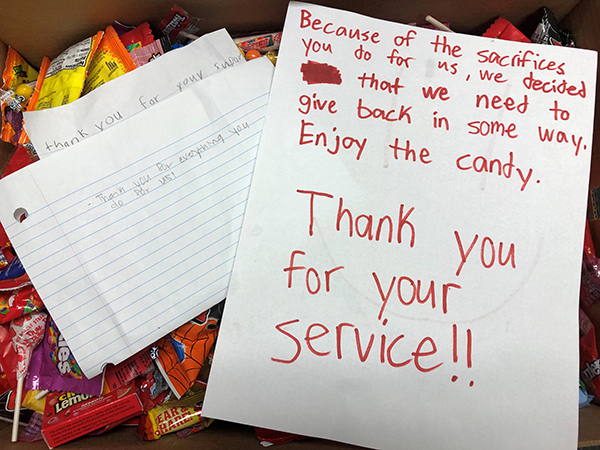

Well SAS, you outdid yourselves once again! For 7 years running, we've been collecting and donating leftover and excess Halloween candy from SAS families. After last year's record breaking 580 pounds of donated candy, we challenged you to raise the {candy} bar even higher this year...and man did you do that,


Staff parties, holiday treats, indoor snow days, the list of welcomed distractions continues. This time of year is full of festivities that call for our attention. The choices can be daunting at times. Sometimes they derail us from our plans and progress. What can you do to manage the madness?
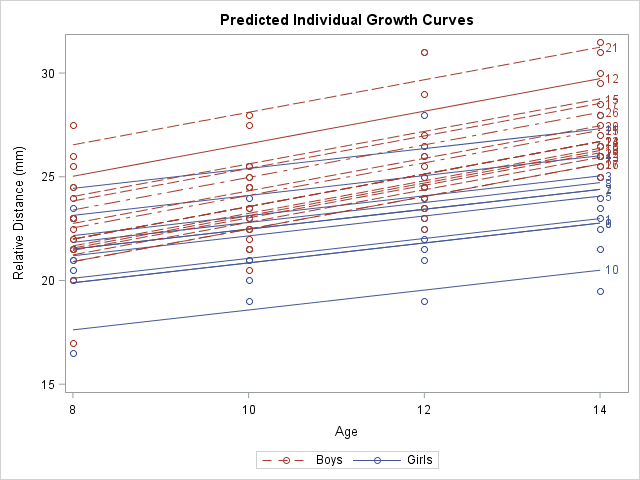

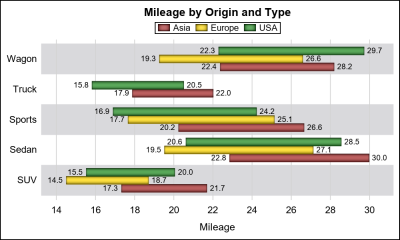
I regularly see questions on a SAS discussion forum about how to visualize the predicted values for a mixed model that has at least one continuous variable, a categorical variable, and possibly an interaction term. SAS procedures such as GLM, GENMOD, and LOGISTIC can automatically produce plots of the predicted


Encouraging data sharing can sometimes feel like refereeing kids on Christmas morning. “Mom said you have to SHARE!” my sister bawled, grabbing at the Game Boy in my hand as I held the toy just out of her reach. I had just gotten it as a Christmas present and had
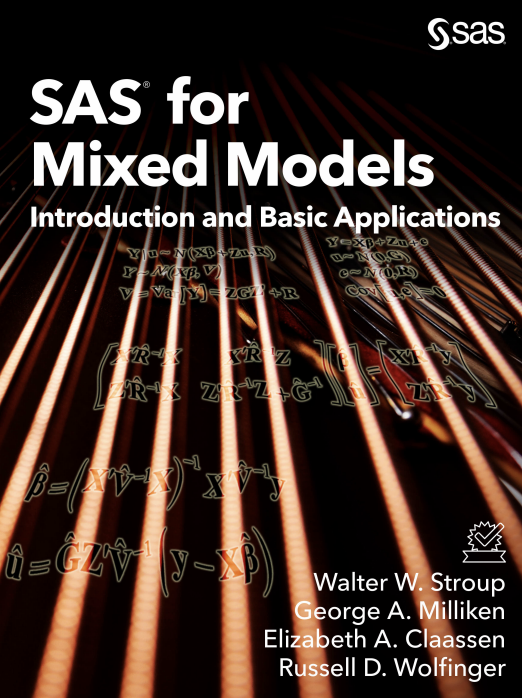

SAS for Mixed Models: Introduction to Basic Applications takes you step-by-step through the journey of creating models, enabling you to transform scores of data into actionable insights.


Típicamente, durante los dos últimos meses del año en las tiendas, centros comerciales y mercados se observan aglomeraciones para adquirir todo tipo de mercancías: regalos, juguetes, dispositivos electrónicos, videojuegos, ropa, vinos y, por supuesto, los alimentos con los que celebrarán las familias la Noche Buena y recibirán el 2019. Asimismo,


Phil Simon raises two key questions to ask in his second post on data literacy.


The Work/Life Book Club is back for another year! We hope you will explore our choices for 2019 and join us for any or all discussions. Book Club discussions will take place from 12:00 - 1:00pm in the designated month and are open to SAS employees and family. Check the
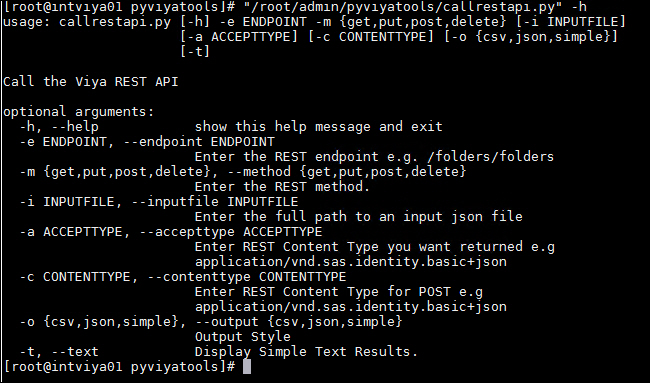

Find out about this new set of tools designed to be used in conjunction with the sas-admin command line interfaces.


지난 9월 중순 미국 샌디에고에서 개최된 최대 규모의 분석 컨퍼런스 ‘SAS 애널리틱스 익스피리언스(Analytics Experience) 2018'의 연사로 참여한 빅데이터 전문가 트리샤 왕(Tricia Wang) 박사는 세계적인 동물행동학자 프란스 드 발(Frans de Waal)의 영상을 공유했습니다. 이 영상은 연구자에게 돌을 주고 보상을 받는 두 마리의 원숭이를 통해 인간의 도덕적 심리를 보여주는데요. 원숭이들은 돌을 건네줄