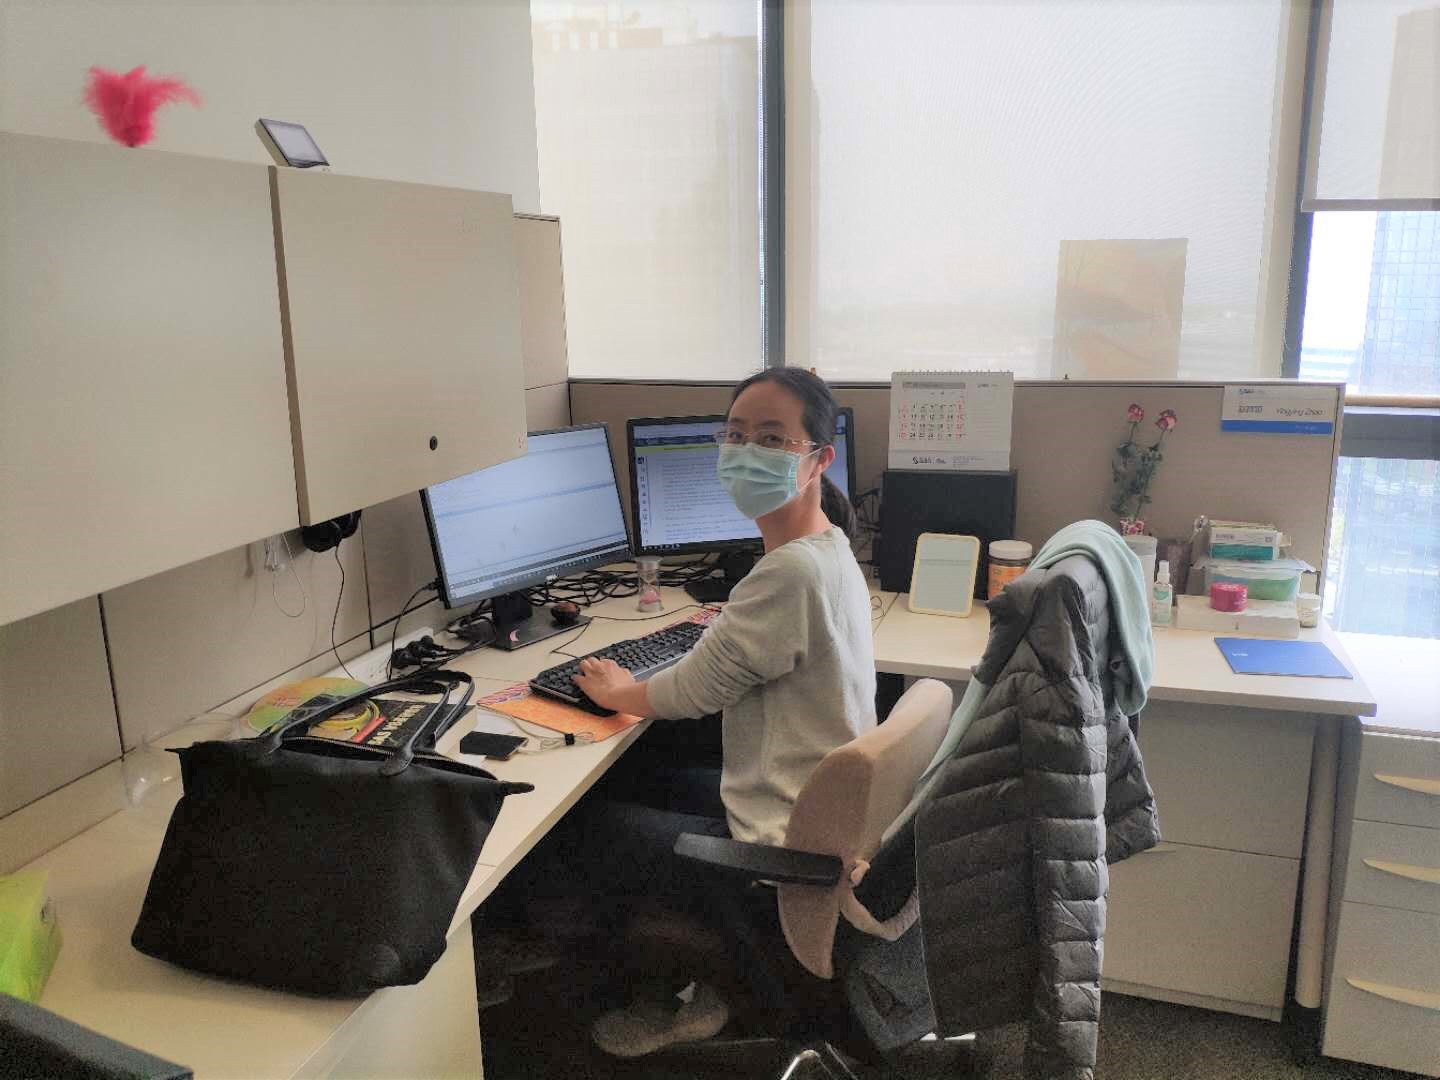
In the first of two posts spotlighting SAS R&D innovators, SAS' Udo Sglavo introduces you to developers Amy Shi, Maggie Du and Phil Helmkamp.
Search Results: ODS Excel (303)
Following is Editor Len Tashman's preview of the new issue of Foresight: The International Journal of Applied Forecasting. Jonathon Karelse, author of the lead story, will be presenting in the Practitioner Track of the International Symposium on Forecasting (June 27-30). Preview of Foresight #61 (2021:Q2) For many years, we’ve identified
Amber Elam of SAS Technical Support reveals common challenges and solutions when you convert external files into SAS data sets.
Note from Udo Sglavo on mathematical optimization: When data scientists look at the essence of analytics and wonder about their daily endeavor, it often comes down to supporting better decisions. Peter F. Drucker, the founder of modern management, stated: "Whenever you see a successful business, someone once made a courageous decision."
This is another in my series of blogs where I take a deep dive into converting a customized R graph into a SAS ODS Graphics graph. This time the example is a needle plot (that's essentially like a bar plot, with lots of tiny bars, plotted along a continuous xaxis).
A note from Udo Sglavo: This post offers an introduction to complex optimization problems and the sophisticated algorithms SAS provides to solve them. In previous posts of this series, we learned that data availability, combined with more and cheaper computing power, creates an essential opportunity for decision-makers. After looking at network analytics
The first principle of analytics is about bringing the right analytics technology to the right place at the right time. Whether your data are on-premises, in the cloud, or at the edges of the network – analytics needs to be there with it. Being true to this principle means we
“Technology is an industry that eats its young, it is rare to come across providers that have been around for more than a human generation.” Tony Bear, Big on Data With more than 40 years in the market, SAS is one of the rare technology providers that has been around
The retail sector has been in a state of change for many years now. Retailers have long been discussing the shift to online – or rather the correct balance between online and "bricks and mortar" – and how to cater to customers’ desire to use multiple channels for different parts
When the automatic time-series techniques can't produce adequately forecasts, a tool should be equipped with multiple machine learning techniques.
Digitalization, big data and AI are changing the role of insurance and, therefore, the role of actuaries. A lot of reports – like McKinsey’s Insurance 2030, Deloitte’s “The Exponential Actuary," or the Big Data and Insurance report by the Geneva Association (a leading think tank of insurance CEOs) depict aspects
Whenever I talk to actuaries across EMEA, they are very consistent in the many anchor points they see for actuarial modernization in order to be future-proof. In this article, I would like to share some of them. Anchor points for actuarial innovation The most time-consuming task is, of course, getting
The most fundamental concept that students learning introductory SAS programming must master is how SAS handles data. This might seem like an obvious statement, but it is often overlooked by students in their rush to produce code that works. I often tell my class to step back for a moment
“SAS co-founder and Executive Vice President, John Sall used to say, ‘SAS was born on a farm, raised on drugs and grew up in the industry,’” recalled Dr. Herb Kirk, explaining the legacy of SAS use in the agriculture and pharmaceutical sectors before expanding into all industries. Before joining SAS
CAS Actions and Action Sets - a brief intro - A quick introduction about the distributed CAS server in SAS® Viya®. Index of articles on Getting Started with Python Integration to SAS Viya. Making a Connection - An introduction to SAS Viya and the massively parallel processing CAS engine, and
As the Virtual SAS® Global Forum 2020 is running live online, we have a guest blog post today from Udo Sglavo, Vice President of Analytics R&D at SAS. Udo is a long time colleague and co-editor (with me and Len Tashman) of Business Forecasting: Practical Problems and Solutions. In this
Critics of sports analytics (and there are some entertaining ones) love to point out that analytics isn’t capable of capturing the things that don’t show up on a box score. A player who dives on the floor to save a loose ball, a quarterback strategically misleading a defender to free
[Jessica Curtis and Adam Hillman, both Forecasting Advisors at SAS, were co-authors of this post] The world has been dramatically impacted by the recent COVID-19 pandemic. Many of us are juggling a completely new lifestyle that was forced upon us overnight. As consumers find their way to a new normal,
Recently I read an excellent blog post by Paul von Hippel entitled "How many imputations do you need?". It is based on a paper (von Hippel, 2018), which provides more details. Suppose you are faced with data that has many missing values. One way to address the missing values is
Written by Alfred Liu, SAS China R&D Alfred Liu, Head of SAS China Research and Development, shares his story about working through the coronavirus outbreak in China, tips for others going through it and his hopes for a return to normal life soon. The Coronavirus Hits On Dec. 31, when
A SAS/IML programmer asked about the best way to print multiple SAS/IML variables when each variable needs a different format. He wanted the output to resemble the "Parameter Estimates" table that is produced by PROC REG and other SAS/STAT procedures. This article shows four ways to print SAS/IML vectors in
SAS' Kris Stobbe shows how you can predict survival rates of Titanic passengers with a combination of both Python and CAS using SWAT, then see how the models performed.
A previous article shows how to interpret the collinearity diagnostics that are produced by PROC REG in SAS. The process involves scanning down numbers in a table in order to find extreme values. This can be a tedious and error-prone process. Friendly and Kwan (2009) compare this task to a
The flu season has started here in the U.S., and according to the Centers for Disease Control and Prevention (CDC) data it has caused 214 deaths in the first week of 2020. Is this number higher, or lower, than usual? When does the flu season start, and how long does
Recently I showed how to visualize and analyze longitudinal data in which subjects are measured at multiple time points. A very common situation is that the data are collected at two time points. For example, in medicine it is very common to measure some quantity (blood pressure, cholesterol, white-blood cell
While growing up in the 80's, I watched The Golden Girls on TV with my Grandma Betty. Now, when my sister visits, we binge watch reruns on TV Land. I was excited when I saw for this Halloween, you could buy Golden Girls costumes! Too bad they sold out right
The connection between SAS Viya and the Austrian mountains Friends from Tyrol recently visited me in Burgenland at Lake Neusiedl. Tyrol is an area famous for really high mountains. Tourists from all over the world come to Tyrol to experience the fantastic views and hikes. So my friends laughed when
Importing about 4,400 messages worth of data into SAS Visual Text Analytics to exploring it and create an information extraction model.
Just when you think you’ve seen it all, life can surprise you in a big way, making you wonder what else you've missed. That is what happened when I recently had a chance to work with the SAS® Scalable Performance Data Server, a product that's been around a while, but
A SAS programmer asked an intriguing question on the SAS Support Communities: Can you use SAS to create a graph that shows how the elements in a box-and-whiskers plot relate to the data? The SAS documentation has several examples that explain how to read a box plot. One of the