Visualizing Scrabble games

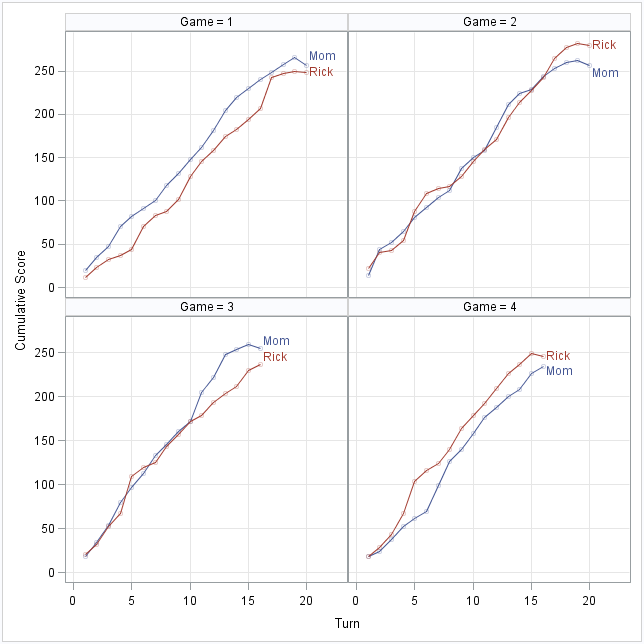
My elderly mother enjoys playing Scrabble®. The only problem is that my father and most of my siblings won't play with her because she beats them all the time! Consequently, my mother is always excited when I visit because I'll play a few Scrabble games with her. During a recent