Here are a few new interface and graphics changes that every SAS programmer should know about SAS 9.3:
- HTML is now the default output destination when you run the SAS windowing environment. This means that tables and graphs appear in an HTML document instead of the classic LISTING destination. Of course, you can get the older output by using the ODS LISTING statement, but I encourage you to give the HTML destination a test drive. Personally, I'm hooked and won't go back! (See the end of this post for the new look.)
- A second major change is that ODS statistical graphics are now part of Base SAS! This will have a huge impact because it brings the power of the SG procedures (SGPLOT, SGPANEL,...) and the Graph Template Language (GTL) to thousands of SAS programmers who have never used modern SAS graphics.
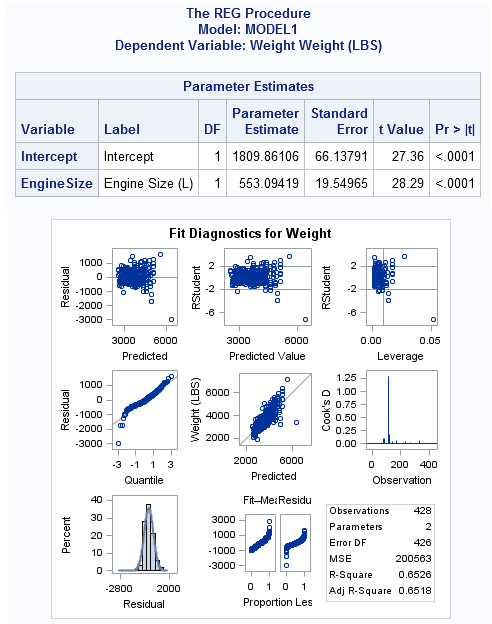
- And speaking of statistical graphics, ODS GRAPHICS are on by default in SAS 9.3. This means that SAS users will automatically see graphs produced by SAS/STAT procedures such as PROC REG. One consequence: SAS loads and initializes the ODS graphics system the first time such a procedure runs. This might require several seconds, so be sure to pre-load ODS graphics if you are giving a demo!
- "Drats," I hear you saying, "all those graphs are going to clutter my hard drive!" But, no! By default, graphs are no longer saved in the SAS current directory; they are saved in the WORK library. Result: when you exit SAS all those graphs vanish in a virtual puff.
- There are several new plot statements in the SGPLOT and SGPANEL procedures. My favorite is the LINEPARM statement, which enables you to create reference lines more easily than was possible in SAS 9.2. A close second place is the addition of options to the HISTOGRAM statement that provide greater control over bin widths.
What are your favorite new features? Browse the What's New in SAS 9.3 document and let me know.

12 Comments
Wow! Exciting news. Can't wait to try SAS 9.3. Now every SAS user can apply the cutting-edge graphics features of SAS.
Can I use transparency in the annotate facility yet? I saw some comments in the release notes about transparency, but didn't understand what they apply to exactly. I like the transparency options in sgplot, but not being able to use them through annotate (or annotate at all in sgplot, or did that change?) means I'm stuck with default graphs...
I haven't used it, but Dan Heath's SAS Global Forum 2011 paper (http://support.sas.com/resources/papers/proceedings11/277-2011.pdf) says that annotation has "transparency support for all primitives" and gives several examples that use transparency.
Yeah, that's one of the papers I saw that left me confused. The whole paper is about sgplot so I still don't know if I can use transparency in gplot, and I don't know what "primitives" are. I know sgplot is nice for putting several plots together, but I prefer to do that using annotate to manually add whatever I want since I don't like the way sgplot outputs the image files. Maybe I just need to learn how to output image files better...
Yes - you can use the new v9.3 alpha-transparency with annotated stuff on traditional gplot, gchart, and gmap (with device=png).
Here is an example using annotated pies/circles on a gmap - it would work similarly with gplot and gchart:
http://www.robslink.com/SAS/democd50/new_93_sas.htm#alpha
SAS 9.3 includes many new features in ODS Graphics. In addition to Rick's favourite (LINEPARM), another new feature particularly useful to track patient data is the support for Cluster Groups for many plots including BoxPlot and support for Interval (Time) axis for BoxPlot..
These options allow easier creation of graphs to track patient response by visit and treatment. The link shows a sample Box Plot created using the SGPLOT Procedure for multiple trreatments over a time x-axis.
https://sites.google.com/site/smatange/ods-graphics/interval-box-plot
Pingback: Five New Features of SAS 9.3 for Statistical Programmers - The DO Loop
Pingback: How to clear the output window in SAS 9.3 - The DO Loop
Pingback: Creating tooltips for scatter plots with PROC SGPLOT - The DO Loop
OK, so it's cool to see the graphicss in HTML, but I need to save and email them to others.
What's the most straightforward way to do that, ideally integrating tables and graphics in the same document?
Then if we are going to submit a manuscript for publication and need high resolution graphics, how would I make separate graphics files?
We are using 9.2 on Unix and 9.3 on Windows.
Ashley, there are many papers on these topics.
First, for distributing results via e-mail, check out this paper on SMTP tricks with the EMAIL access method on the FILENAME statement:
http://support.sas.com/resources/papers/proceedings10/060-2010.pdf
In my opinion, the most effective way to send results as e-mail is to use ODS PDF as the destination (so text, tables, and graphs are in one document) and then send that PDF as an attachment -- all feasible in SAS.
For fancier results, you can try ODS PACKAGE, which allows you to combine different results in a ZIP archive (which you can then attach to e-mail). It's described in this paper:
http://support.sas.com/resources/papers/proceedings09/018-2009.pdf
For creating journal-quality graphs using the SG procedures and ODS graphics, see:
http://support.sas.com/resources/papers/proceedings09/174-2009.pdf
There are multiple ways to do this. One would be to close the HTML destination and use the RTF destination for your output. Now, the tables and graphs will go to a .rtf file that can be opened in Word. No separate graph image files are created. To do that, simply also open the LISTING destination so now the graphs will also be created in your user folder. Note, the graphs for each destination will use the default styles for each, so the appearance of the graphs n RTF may look different from LISTING. To address this, just set the same style on each destination.