Search Results: simulation (475)

Mike Gilliland 0
Forecasting and analytics at Disney World

The April 2012 issue of ORMS Today contains a piece on "How analytics enhance the guest experience at Walt Disney World," by Pete Buczkowski and Hai Chu. While many of us are used to forecasting just one or two things (such as unit sales or revenue), Pete and Hai illustrate

Data Visualization
Sanjay Matange 0
Cluster groups

The topic of cluster groups comes up often.  By cluster group I am referring to the feature in bar charts where the group values are displayed side by side. With SAS 9.3, SG Procedures support stack or cluster grouping for Bar Charts and overlay or cluster grouping for all other

Analytics | Risk Management
Leo Sadovy 0
Conversational analytics

When you begin your career your most important skills are your hard, technical skills; the finance and accounting, the statistics and economics, the physics and chemistry, the engineering and calculus.  But as I tell my business school mentees, as your career progresses, the emphasis changes such that much sooner than

Rick Wicklin 0
Generating a random orthogonal matrix

Because I am writing a new book about simulating data in SAS, I have been doing a lot of reading and research about how to simulate various quantities. Random integers? Check! Random univariate samples? Check! Random multivariate samples? Check! Recently I've been researching how to generate random matrices. I've blogged

Rick Wicklin 0
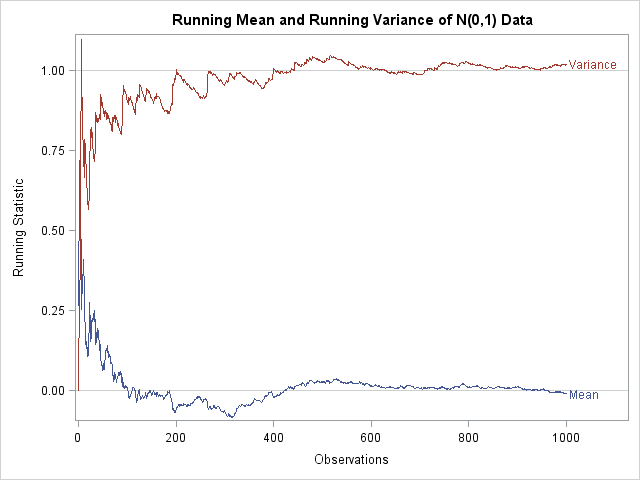
Compute a running mean and variance

In my recent article on simulating Buffon's needle experiment, I computed the "running mean" of a series of values by using a single call to the CUSUM function in the SAS/IML language. For example, the following SAS/IML statements define a RunningMean function, generate 1,000 random normal values, and compute the

Leo Sadovy 0
Metrics for the subconscious organization

Think about what it’s like to learn to ride a bicycle, or play the piano, or hit a fast ball, or to coach a group of middle schoolers to do the same. If asked to explain how you stay balanced on a bicycle, you probably couldn’t do it. If you

Rick Wicklin 0
New 2012 resolutions for my blog

Hello, 2012! It's a New Year and I'm flushed with ideas for new blog articles. (You can also read about The DO Loop's most popular posts of 2011.) The fundamental purpose of my blog is to present tips and techniques for writing efficient statistical programs in SAS. I pledge to

Rick Wicklin 0
Four essential functions for statistical programmers

Normal, Poisson, exponential—these and other "named" distributions are used daily by statisticians for modeling and analysis. There are four operations that are used often when you work with statistical distributions. In SAS software, the operations are available by using the following four functions, which are essential for every statistical programmer

Rick Wicklin 0
Multithreaded = more productive

NOTE: SAS stopped shipping the SAS/IML Studio interface in 2018. It is no longer supported, so this article is no longer relevant. When I write SAS/IML programs, I usually do my development in the SAS/IML Studio environment. Why? There are many reasons, but the one that I will discuss today

Advanced Analytics
Mike Gilliland 0
Announcing: SAS Forecast Server 4.1

Tuesday's release of SAS 9.3 included the new SAS Forecast Server 4.1, which has several valuable enhancements: Combination (Ensemble) Models: A combination of forecasts using different forecasting techniques can outperform forecasts produced by using any single technique. Users can combine forecasts produced by many different models using several different combination

Rick Wicklin 0
Simulate categorical data in SAS

As I was reviewing notes for my course "Data Simulation for Evaluating Statistical Methods in SAS," I realized that I haven't blogged about simulating categorical data in SAS. This article corrects that oversight. An Easy Way and a Harder Way SAS software makes it easy to sample from discrete "named"

Rick Wicklin 0
Blogging, programming, and Johari windows

My primary purpose in writing The DO Loop blog is to share what I know about statistical programming in general and about SAS programming in particular. But I also write the blog for various personal reasons, including the enjoyment of writing. The other day I encountered a concept on Ajay

Rick Wicklin 0
Funnel plots: An alternative to ranking

In a previous blog post, I showed how you can use simulation to construct confidence intervals for ranks. This idea (from a paper by E. Marshall and D. Spiegelhalter), enables you to display a graph that compares the performance of several institutions, where "institutions" can mean schools, companies, airlines, or

1 13 14 15 16