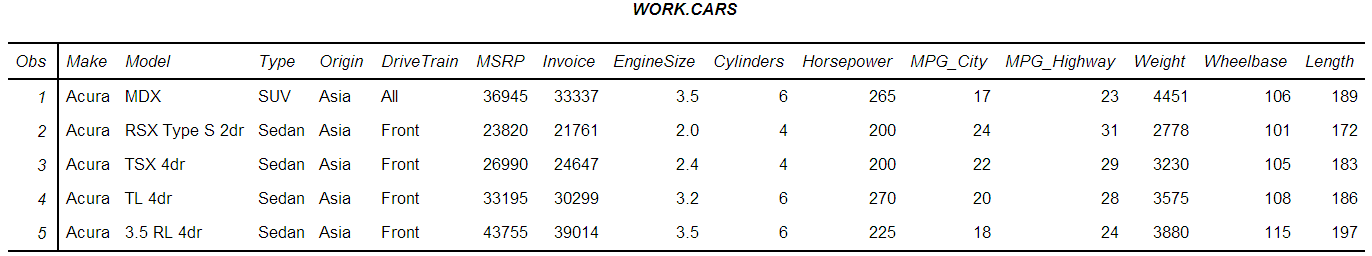
A statistical analysis of Stephen Curry's shooting

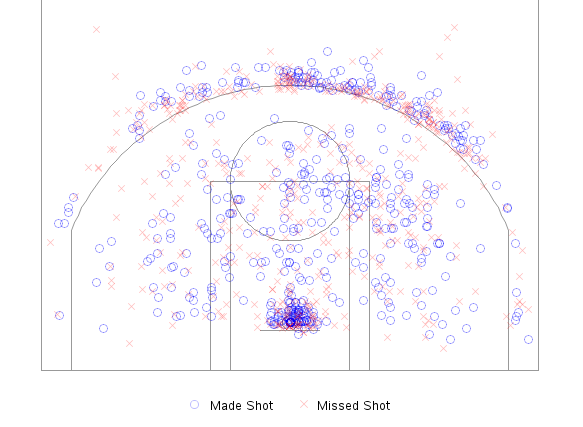
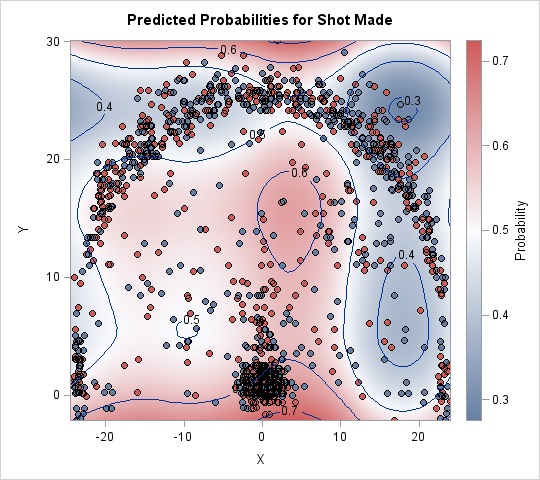
Last week Robert Allison showed how to download NBA data into SAS and create graphs such as the location where Stephen Curry took shots in the 2015-16 season to date. The graph at left shows the kind of graphs that Robert created. I've reversed the colors from Robert's version, so