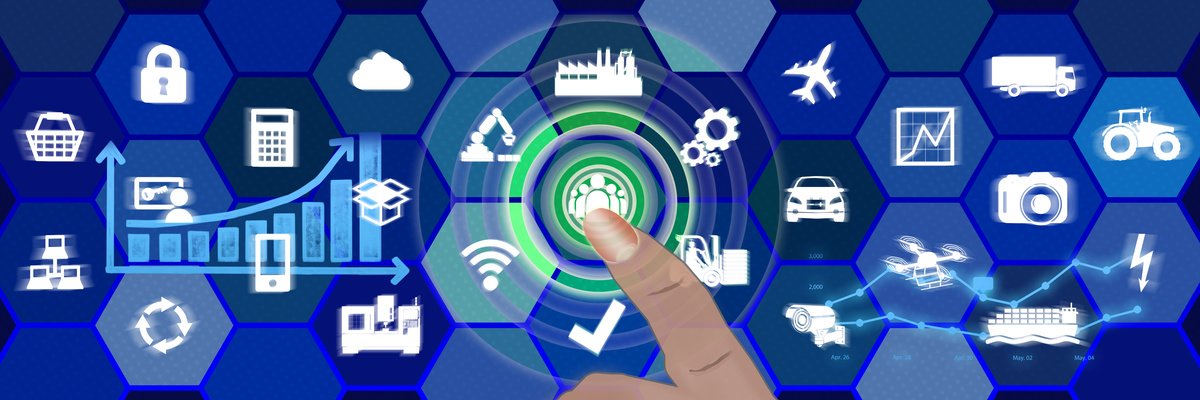
Yearly Archives: 2016

Analytics
Ralf Storch 0
Big Data und die Möglichkeiten der SAS In-Database-Verarbeitung

In der heutigen Zeit macht es immer weniger Sinn, gigantische Datenmengen über das Netzwerk in ein Auswertetool zur Analyse zu übertragen. Der Geschwindigkeitsvorteil einer hoch performanten statistischen Analyse von riesigen Datenmengen wird durch die lange Datenübertragung dieser riesigen Datenmengen wieder zunichtegemacht. An diesem Punkt müssen andere Technologien angewendet werden, um

Karen Terrell 0
Analytics transforming the 2020 U.S. Census

One of our country's oldest institutions, the U.S. Census Bureau, is at the forefront of modern government efforts. Those efforts are numerous and disparate, from general directives to do more with less, to digitization and consolidation initiatives, to the “Cloud First” mandate, and the pushes for agile and open source development.

Mike Henderson 0
Reproducible research: Is my SAS code enough?

There was this very embarrassing day around year six of my career as a statistician working in clinical trials. I had a small group of interns working on a project that combined data from multiple clinical trials. The goal was to better understand sources of variation in the common control

Learn SAS
Rick Wicklin 0
The SELECT statement in the SAS DATA step

Every beginning SAS programmer learns the simple IF-THEN/ELSE statement for conditional processing in the SAS DATA step. The basic If-THEN statement handles two cases: if a condition is true, the program does one thing, otherwise the program does something else. Of course, you can handle more cases by using multiple

Data Visualization
Sanjay Matange 0
Scalable Turnip Graph

A Turnip Graph displays the distribution of an analysis variable.  The graph displays markers with the same (or close) y coordinate by displaying the markers spread out over the x-axis range in a symmetric pattern.  Recently, a question was posted on the SAS Communities page regarding such a graph. Here is an example of

Analytics
Ralf Storch 0
Kundenindividuelle Versicherungstarife und Datenschutz?

Mit fortschreitender Digitalisierung entdecken immer mehr Versicherer neue Möglichkeiten der Tarifgestaltung. Hierzu zählen aktuell sogenannte Telematik-Tarife, die das individuelle Fahrverhalten der Versicherten berücksichtigt. Zur Bewertung des Fahrverhaltens werden mittels einer Blackbox Daten wie z. B. gefahrene Kilometer, Beschleunigung und Bremsverhalten gesammelt. Aus diesen unterschiedlichen Kennzahlen wird mittels analytischer Verfahren ein fahrerspezifischer

Matt Becker 0
Three things you must do to create a central clinical platform

Collecting, managing, standardizing and analyzing clinical data during (and after) a clinical trial is crucial in the process for submission and regulatory approval of a new compound, biological, device or other therapy. A central clinical platform requires: Robust and auditable analytics to prove the result to the authorities and external

1 22 23 24 25 26 45