How much does this big pumpkin weigh? One of the cafeterias at SAS invited patrons to post their guesses on an internal social network at SAS. There was no prize for the correct guess; it was just a fun Halloween-week activity. I recognized this as an opportunity to apply the
Tag: Statistical Thinking
When modeling and simulating data, it is important to be able to articulate the real-life statistical process that generates the data. Suppose a friend says to you, "I want to simulate two random correlated variables, X and Y." Usually this means that he wants data generated from a multivariate distribution,
In a previous post I described how to simulate random samples from an urn that contains colored balls. The previous article described the case where the balls can be either of two colors. In that csae, all the distributions are univariate. In this article I examine the case where the
If not for probability theory, urns would appear only in funeral homes and anthologies of British poetry. But in probability and statistics, urns are ever present and contain colored balls. The removal and inspection of colored balls from an urn is a classic way to demonstrate probability, sampling, variation, and
Last week I discussed ordinary least squares (OLS) regression models and showed how to illustrate the assumptions about the conditional distribution of the response variable. For a single continuous explanatory variable, the illustration is a scatter plot with a regression line and several normal probability distributions along the line. The
A friend who teaches courses about statistical regression asked me how to create a graph in SAS that illustrates an important concept: the conditional distribution of the response variable. The basic idea is to draw a scatter plot with a regression line, then overlay several probability distributions along the line,
Perhaps you saw the headlines earlier this week about the fact that it has been nine years since the last major hurricane (category 3, 4, or 5) hit the US coast. According to a post on the GeoSpace blog, which is published by the American Geophysical Union (AGU), researchers ran
The Monty Hall Problem is one of the most famous problems in elementary probability. It is famous because the correct solution is counter-intuitive and because it caused an uproar when it appeared in the "Ask Marilyn" column in Parade magazine in 1990. Discussing the problem has been known to create
I've written about how to generate a sample from a multivariate normal (MVN) distribution in SAS by using the RANDNORMAL function in SAS/IML software. Last week a SAS/IML programmer showed me a program that simulated MVN data and computed the resulting covariance matrix for each simulated sample. The purpose of
I sometimes wonder whether some functions and options in SAS software ever get used. Last week I was reviewing new features that were added to SAS/IML 13.1. One of the new functions is the CV function, which computes the sample coefficient of variation for data. Maybe it is just me,
In my article about how to create a quantile plot, I chose not to discuss a theoretical issue that occasionally occurs. The issue is that for discrete data (which includes rounded values), it might be impossible to use quantile values to split the data into k groups where each group
What is kurtosis? What does negative or positive kurtosis mean, and why should you care? How do you compute kurtosis in SAS software? It is not clear from the definition of kurtosis what (if anything) kurtosis tells us about the shape of a distribution, or why kurtosis is relevant to
The tail of a probability distribution is an important notion in probability and statistics, but did you know that there is not a rigorous definition for the "tail"? The term is primarily used intuitively to mean the part of a distribution that is far from the distribution's peak or center.
Wisdom has built her house; She has hewn out her seven pillars. – Proverbs 9:1 At the 2014 Joint Statistical Meetings in Boston, Stephen Stigler gave the ASA President's Invited Address. In forty short minutes, Stigler laid out his response to the age-old question "What is statistics?" His answer was
As the International Year of Statistics comes to a close, I've been reflecting on the role statistics plays in our modern society. Of course, statistics provides estimates, forecasts, and the like, but to me the great contribution of statistics is that it enables us to deal with uncertainty in a
Should you ever guess on the SAT® or PSAT standardized tests? My son is getting ready to take the preliminary SAT (PSAT), which is a practice test for the SAT. A teacher gave his class this advice regarding guessing: For a multiple-choice questions, if you can eliminate one or two
This week I read an interesting blog post that led to a discussion about specifying the frequencies of observations in a regression model. In SAS software, many of the analysis procedures contain a FREQ statement for specifying frequencies and a WEIGHT statement for specifying weights in a weighted regression. Theis
As I wrote in my previous post, a SAS customer noticed that he was getting some duplicate values when he used the RAND function to generate a large number of random uniform values on the interval [0,1]. He wanted to know if this result indicates a bug in the RAND
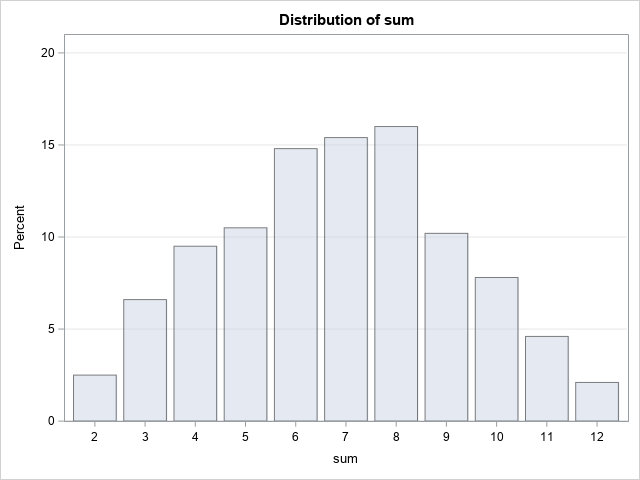
Tossing dice is a simple and familiar process, yet it can illustrate deep and counterintuitive aspects of random numbers. For example, if you toss four identical six-sided dice, what is the probability that the faces are all distinct, as shown to the left? Many people would guess that the probability
I often see variations of the following question posted on statistical discussion forums: I want to bin the X variable into a small number of values. For each bin, I want to draw the quartiles of the Y variable for that bin. Then I want to connect the corresponding quartile
In this International Year of Statistics, I'd like to describe the major role of statistics in public health advances. In our modern society, it is sometimes difficult to recall the huge advances in health and medicine in the 20th century. To name a few: penicillin was discovered in 1928, risk
This is a third post on newspaper stories that I recently read. Today's post deals with science, politics, and rising sea levels. Incidentally, the title is a blatant reference to John Allen Paulos's brilliant book, A Mathematician Reads the Newspaper. Senate approves law that challenges sea-level science The NC legislature
This is my second post on some newspaper articles that I recently read. Today's post deals with academic fraud. Questions linger in academic fraud case Over the past year, the News and Observer has occasionally reported on a scandal at the University of North Carolina at Chapel Hill in which
This past weekend was Father's Day, so I took some time to relax and read the newspaper. I found several stories that suggested interesting statistical questions. Unfortunately, the data are not available for analysis. Nevertheless, the stories are worth sharing. Over the next few days, I'll post my thoughts on
A collegue who works with time series sent me the following code snippet. He said that the calculation was overflowing and wanted to know if this was a bug in SAS: data A(drop=m); call streaminit(12345); m = 2; x = 0; do i = 1 to 5000; x = m*x
After my post on detecting outliers in multivariate data in SAS by using the MCD method, Peter Flom commented "when there are a bunch of dimensions, every data point is an outlier" and remarked on the curse of dimensionality. What he meant is that most points in a high-dimensional cloud
I previously described how to use Mahalanobis distance to find outliers in multivariate data. This article takes a closer look at Mahalanobis distance. A subsequent article will describe how you can compute Mahalanobis distance. Distance in standard units In statistics, we sometimes measure "nearness" or "farness" in terms of the
I was on vacation when a family member sidled up to me. "Rick, you're a statistician..." he began. I knew I was in trouble. He proceeded to tell me the story of Joseph "Newsboy" Moriarty, a New Jersey mobster who rose to prominence and became known as the bookie who
It is "well known" that the pairwise deletion of missing values and the resulting computation of correlations can lead to problems in statistical computing. I have previously written about this phenomenon in my article "When is a correlation matrix not a correlation matrix." Specifically, consider the symmetric array whose elements
Yesterday, December 7, 1941, a date which will live in infamy... - Franklin D. Roosevelt Today is the 70th anniversary of the Japanese attack on Pearl Harbor. The very next day, America declared war. During a visit to the Smithsonian National Museum of American History, I discovered the results of