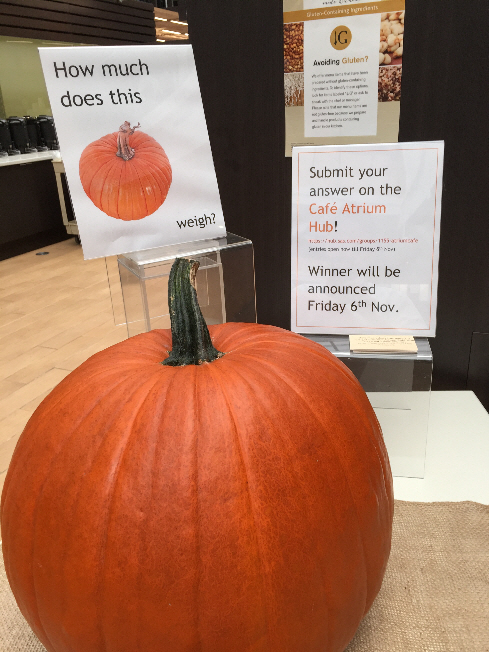
How much does this big pumpkin weigh? One of the cafeterias at SAS invited patrons to post their guesses on an internal social network at SAS. There was no prize for the correct guess; it was just a fun Halloween-week activity.
I recognized this as an opportunity to apply the "wisdom of the crowd" to create a potentially winning guess. Because the guesses were being posted to an online community, I could see all the guesses. My hypothesis was that the average of other people's guesses would be an accurate prediction for the pumpkin's weight. I decided to wait five days before submitting my prediction.
The following SAS data set shows the complete set of guesses for the pumpkin's weight. The first line after the DATALINES statement shows the 10 guesses that were submitted during the first five days. The second line shows my guess, which was 36 pounds. The third line shows subsequent guesses. The call to PROC MEANS shows the analysis of the first 10 guesses:
data guess; N = _N_; input Weight @@; sum + Weight; label Mean = "Running Mean" N = "Patron ID"; if N > 2 then Mean = sum / N; datalines; 37.5 35 47.5 14.5 25.5 36.6 17.2 51 32.4 37.5 36 39.7 42 43.6 46 35.2 36.75 28.7 42.4 40.2 48 ; proc means data=guess(obs=10) N mean median min max; var Weight; run; |
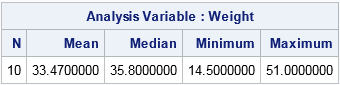
The output from PROC MEANS shows that the mean value of the first 10 guesses was 33.47. Because the range of guesses included values that I considered to be extreme, I decided instead to use the median value (35.8), which I rounded to 36 pounds. That was my guess.
Over the next few days 10 additional guesses were posted. Finally, the pumpkin's weight was revealed: it was 35 pounds. My prediction, which was based on the "wisdom" of 10 previous guesses, was within 3% of the true value. However, I did not win the contest because in fact the true weight of the pumpkin was guessed by the second person to enter the contest!
The following graph shows the sequence of guesses. My guess is marked with a star. The true weight of the pumpkin is indicated by a horizontal line. The running mean is shown as a jagged line. You can see that the running mean is very close to the true value after only a few guesses. The running mean was closer to the true value than most of the guesses.
data Augment; set guess; if N = 11 then Rick = 36; else Rick = .; label Rick = "Rick's Guess"; run; proc sgplot data=Augment; scatter x=N y=Weight / legendlabel="Guess"; scatter x=N y=Rick / markerattrs=(symbol=starfilled size=12 color=red); series x=N y=Mean; xaxis grid; yaxis grid; refline 35 / axis=y lineattrs=(color=blue); run; |

Using the "wisdom of the crowd" to estimate a weight has a long history that pre-dates this pumpkin-guessing contest. In 1906 Francis Galton, who introduced many important concepts in statistics, was at a county fair when he noticed a contest that encouraged fairgoers to guess the weight of an ox. After the contest ended, he obtained the paper guesses for almost 800 villagers. He computed the median guess and noticed that it was within 1% of the true weight. He called this phenomenon vox populi or "the voice of the people."
Statistically speaking, there is a difference between Galton's procedure and my own. In the pumpkin-guessing contest, everyone could see the other guesses, which means that the guesses were not independent. Because others had guessed in the range 15–50 pounds, it was unlikely that someone new would guess an extreme value such as 10 or 100 pounds, which introduced bias. Furthermore, because only the first person to correctly guess the weight would be the winner, participants presumably modified their guesses and chose a weight that had not yet been submitted, thus preventing duplicate guesses.
Nevertheless, this simple experiment shows that combining multiple predictions can often result in a prediction that is superior to the original predictions. In statistics this is called an ensemble model or a consensus model. Ensemble models are used to predict the path and intensity of hurricanes and even to predict which movies you will enjoy watching on Netflix.
Taking a mean or median is a very simple kind of ensemble model. The GLMSELECT procedure in SAS/STAT software enables you to perform model averaging as part of constructing a parsimonious linear regression model. SAS Enterprise Miner contains several sophisticated predictive algorithms that use ensemble models; see Maldonado, et al. (2014), "Leveraging Ensemble Models in SAS Enterprise Miner."

5 Comments
That's an amazing finding!!!!! Very interesting contest!
The Sir Francis Galton story is interesting history, as I wrote about in this Wisdom of Crowds post. The PBS website still hosts the Nova Science NOW video on this, hosted by crowd-pleasing scientist Neil deGrasse Tyson.
An interesting analysis... I wonder what the impact (on behaviour and analysis) would have been if the winner wasn't the first correct entry. Thanks for sharing.
Seeing how easy it is to make little plots like this that have a surprising amount of complexity, is a great advertisement for SGPLOT. I started following your blog a few years ago, and a year or so of seeing such plots was enough to convince me that I needed to spend some time in SG / GTL - land, and I'm very glad I did. So thank you for these examples.
Nice piece. I suspect that the reason that somebody was 'spot on' is that there is not a lot of variance. It's going to be above (say) 10 and below (say) 100. It's not like the original pig (was it?), or a jar of sweets where the range of possible values is a lot more.