Levy flight and vectorizing a simulation in SAS

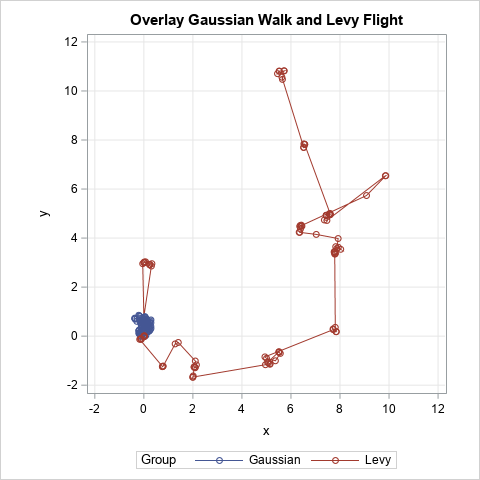
A previous article shows a simulation of two different models of a foraging animal. The first model is a random walk, which assumes that the animal chooses a random direction, then takes a step that is distributed according to a Gaussian random variable. In the second model, the animal again