English

Data Visualization | Learn SAS
Rick Wicklin 0
The path of zip codes

Toe bone connected to the foot bone, Foot bone connected to the leg bone, Leg bone connected to the knee bone,...              — American Spiritual, "Dem Bones" Last week I read an interesting article on Robert Kosara's data visualization blog. Kosara connected the geographic centers of the US zip codes in

Analytics | Data for Good
Shannon Heath 0
How did one school system save money, improve local traffic and make students happier? With fewer bus stops and better bus schedules

Every fall, highways, backroads and neighborhood streets nationwide take on a noticeable yellow hue, as school buses carefully and methodically transport students back to school. In some areas, including Boston, this massive transportation exercise can present a number of challenges. Boston Public Schools (BPS) provided transportation for 25,000 students via

Analytics | Programming Tips
Rick Wicklin 0
Symbolic derivatives in SAS

Did you know that you can get SAS to compute symbolic (analytical) derivatives of simple functions, including applying the product rule, quotient rule, and chain rule? SAS can form the symbolic derivatives of single-variable functions and partial derivatives of multivariable functions. Furthermore, the derivatives are output in a form that

Work & Life at SAS
Celeste Cooper 0
Beyond the Mat

As the summer season begins to become part of the past and we return to a “normal” schedule, I’m reminded that there is still something celebratory as we slowly make our way into the autumn season. It’s yoga! September is National Yoga Month. It is a national health observance designated

Work & Life at SAS
Page Cvelich 0
Tweens and Sleep

Parents, I don’t need to tell you three obvious things: Sleep is critical to our well-being (no matter what age you are). Ask any primary care physician or therapist. Tweens and teens need more sleep than they get (need an average of 9-10 hours, but almost half get fewer than

Analytics
Rick Wicklin 0
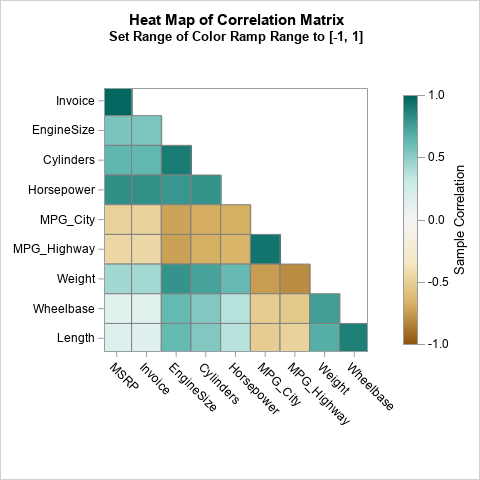
7 ways to view correlation

Correlation is a fundamental statistical concept that measures the linear association between two variables. There are multiple ways to think about correlation: geometrically, algebraically, with matrices, with vectors, with regression, and more. To paraphrase the great songwriter Paul Simon, there must be 50 ways to view your correlation! But don't

Work & Life at SAS
Rebecca Allen 0
Move of the Month: Turkish Getup

Everybody GET UP! Want to train the entire body in one exercise?  This is it!  The Turkish Getup is a multi-joint, multi-movement exercise that incorporates transitioning from the ground to standing.  This exercise requires synergy, coordination, and core/shoulder stabilization to increase your functional strength.  It may seem daunting, but it is

1 147 148 149 150 151 321