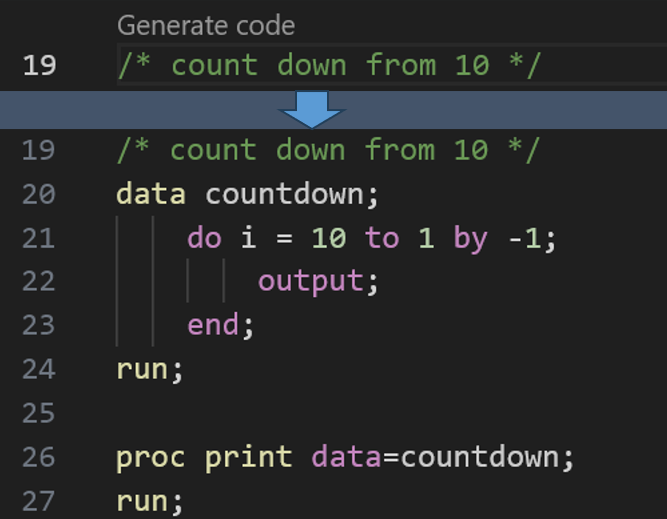
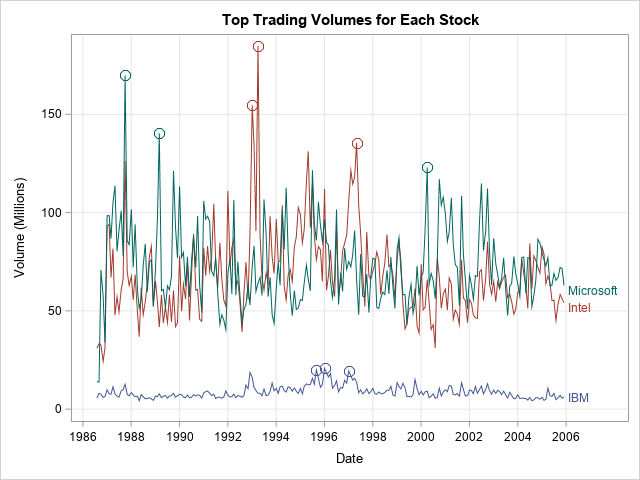
새로운 국제회계기준 IFRS(International Financial Reporting Standards) 17은 보험 업계 역사에 한 획을 긋는 대대적인 변화입니다. 보험 부채의 평가 기준을 원가에서 시가로 변경하는 것을 골자로 보험사의 재무 보고 투명성을 높이기 위한 일련의 새로운 규칙을 명시하는데요. 오래 전부터 이러한 변화를 기다려온 분석가와 여러 이해관계자들에게는 매우 반가운 소식일 것입니다. 실제 IFRS 17은 다양한 국가별
Note: Following is an eight-part serialization of selected content from Steve Morlidge's The Little (Illustrated) Book of Operational Forecasting. What IS a forecast? First of all, we need to be absolutely clear what a forecast is – and what it isn’t. A forecast is a best estimate of future
When you hear someone refer to an ‘inside baseball’ move, it means they’re playing into the subtleties of the game. Inside baseball requires a high level of awareness, experience, and strategic thought. This typically results in a mix of strategies to get runners on base and manufacture runs rather than
The Little (Illustrated) Book of Operational Forecasting Steve Morlidge's latest work, The Little (Illustrated) Book of Operational Forecasting, is a unique contribution to the field. It is a guide for short term operational forecasting, delivered in a pocket-sized format, through 79 brief (two page) illustrated lessons. As I stated in my
Using small multiples is a neat way to display a lot of information in a small amount of space. But depending on how deeply you want to analyze and scrutinize the data, you need to be careful in choosing just how small you make your small multiples. Let's look at
I love data; I’m a real and unabashed data geek. I'm the sci-fi nerd who has fun with data from Star Wars and analyzes World of Warcraft logs using SAS. More importantly, I love what data can do. I love the way it can show people new insights and new ideas,
Video killed the radio star.... We can't rewind, we've gone too far. -- The Buggles (1979) "You kids have it easy," my father used to tell me. "When I was a kid, I didn't have all the conveniences you have today." He's right, and I could say the same
Have you ever wanted to see examples of all of the output styles that SAS provides? You can run a program and look at the resulting file, styles.html. This post explains more about the styles that you will see including a discussion of attribute priority.
Get ready to have your mind blown. Whether or not you plan to attend Analytics Experience in San Diego on September 17, you'll be inspired by the speakers we have lined up to keynote the event. There's an inventor. A data scientist. A world class athlete. And a photographer. They've
Avoid frustrations by following these 5 tips from David Loshin to create a successful data management strategy for analytics.
When I'm at a social gathering, someone always asks what type of work I do. I like to keep my social life separate from my work, therefore I usually give a vague answer such as "software" (and quickly change the topic). How vague or specific is your response? How vague
This article shows how to perform an optimization in SAS when the parameters are restricted by nonlinear constraints. In particular, it solves an optimization problem where the parameters are constrained to lie in the annular region between two circles. The end of the article shows the path of partial solutions
그래프를 만들 때 가장 어려운 작업은 무엇일까요? 바로 데이터를 준비하는 것인데요. 오늘은 엑셀 데이터를 SAS로 가져오고, 전치하고, 첫 열의 값을 데이터 값으로 사용하고, 플롯으로 요약하는 방법을 차례대로 소개해드리고자 합니다. 오늘 예시에서는 학생 대출 채무에 관한 데이터가 사용되는데요. 몇 년 전, 학생 대출 채무가 급증하면서 큰 이슈가 됐었고, 아래는 관련 기사에서 쓰인
Even though I’ve worked at SAS for nearly 30 years, I still get excited when great things come together for our customers! This year we are hosting the very first hackathon at our Analytics Experience conference in San Diego - the AnalyticsX Hackathon. Analytics Experience is in its third year
I bet you were not expecting a photo of 22 youngsters in swimsuits in a math blog, were you? The first time I heard about this reality TV show called "Are You The One?", my nerdiness and love for OR yelled at me: "There is so much math in this
In the oil industry you can make or lose money based on how good your forecasts are, so I’ve pulled together six papers that discuss different ways in which you can leverage analytics to optimize your output and more accurately predict your production performance. Written by employees at oil and
My colleague, Robert Allison, recently published an interesting visualization of the relationship between chess ratings and age. His post was inspired by the article "Age vs Elo — Your battle against time," which was published on the chess.com website. ("Elo" is one of the rating systems in chess.) Robert Allison's
People across the country (and world) are not getting the care they need. There are many data efforts to address that, but I personally believe traditional analytics are short-sighted, too illness-focused, and remarkably negative. We need to take a more holistic approach to data, policy, and health care, including traditional
I am unabashedly a data zealot, but not a data scientist. I believe in the power of data and data analytics, and that the data revolution has started. It will transform all our lives in ways we cannot even imagine. This is one of the things that attracted me to
Elections are in the news again, therefore I have been on the lookout for interesting graphs. I recently found some graphs of the Census Current Population Survey (CPS) Voting and Registration Supplement data, and tried to improve them. Follow along if you're interested in voter data, or creating better graphs!
Better decisions and analytics innovation – fringe benefits of having comprehensive data governance policies.
Hash tables are a very powerful and flexible data structure. Most SAS applications of hash tables focus on just one of their many powerful facilities: table lookup. Hash tables are a fantastic table lookup tool and their use for that should never be diminished. However, hash tables can do so
In machine learning, a feature is another word for an attribute or input, or an independent variable. What is feature engineering? Feature engineering is a process of preparing inputs for machine learning models. The goal of feature engineering is to to improve classification accuracy by considering the limitations of the
Interessanterweise sprachen mich in den letzten Monaten viele Unternehmen der unterschiedlichsten Branchen an und erzählten mir, dass sie sich eben nicht an den „Leuchtturm“-Beispielen ihrer eigenen Branche messen lassen wollen, sondern am „besten Unternehmen in Bezug auf ein herausragendes Kundenerlebnis“. Kurz: Sie wollen so sein wie Amazon. Es sieht wirklich
We’re bringing the concept of #VideoTag to LinkedIn. What's #VideoTag, you ask? It's an online adaptation of the old schoolyard game. In short, you record a video of yourself, upload it to LinkedIn and tag others to respond. It’s a fun, easy way to spur conversation online by showing your
I peruse many different websites to get my news, and I always keep an eye out for good (or bad) presentations of data. I recently saw a posting on reddit claiming "U.S. GDP is greater than the total of all others combined." This news seemed too good to be true
The SGPLOT procedure in SAS makes it easy to create graphs that overlay various groups in the data. Many statements support the GROUP= option, which specifies that the graph should overlay group information. For example, you can create side-by-side bar charts and box plots, and you can overlay multiple scatter
나만의 파라다이스를 찾아라! 여름 휴가 계획 모두 세우셨나요? 어디로 갈지 아직 고민 중이시라면! 클릭 몇 번만으로 전 세계에서 나와 가장 잘 맞는 도시를 알려주는 ‘SAS 파라다이스 파운드(SAS Paradise Found)’ 프로젝트를 소개합니다. 사람마다 매력적인 여행지와 거주지를 선택하는 기준은 다르기 마련인데요. SAS 파라다이스 컨피규레이터(Paradise Configurator)는 가족, 문화, 자연, 안전 및 인프라, 생활비, 레스토랑
How important is the customer experience in communications today? “Very important” is an understatement. It should be the top area of focus for all communications providers. It’s no secret that when customers are extremely satisfied, they become brand champions for the companies that provide them the products and services they
There are many quotes with words of wisdom to help you live your life. But sometimes one quote seems to contradict another. For example, "Don't sweat the small stuff." ... and "The devil is in the details." When it comes to creating graphs (and perhaps living my life in general),