It seems only a few months back I posted an article on creating Pie Charts using a GTL based macro. Well, looking back, that was almost 6 years ago!! Recently, a colleague here at SAS needed to create Pie Charts in his report along with other plots created using SGPLOT procedure. While it is certainly possible to create great Pie Charts using the GCHART procedure, he wanted something that was consistent with the graphs created using the SG procedures.
I referred him to the macro, which he used to do most of his work. But, over the past 6 years, new features have been added, some of which are applicable to the Pie Charts too. So, it seems it may be a good time to update the pie Chart Macro. I added the following features to the Pie Chart Macro.
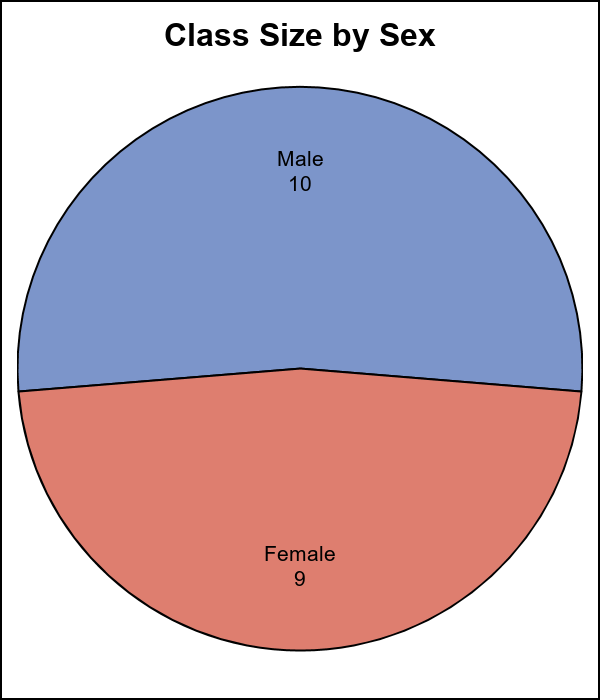
Default use of CENTERFIRSTSLICE. When there are pies with 2 slices, this creates a nicer symmetric view. The centering can be at any angle, but best angles are multiples of 90. Centering also works fine for cases with multiple slices.
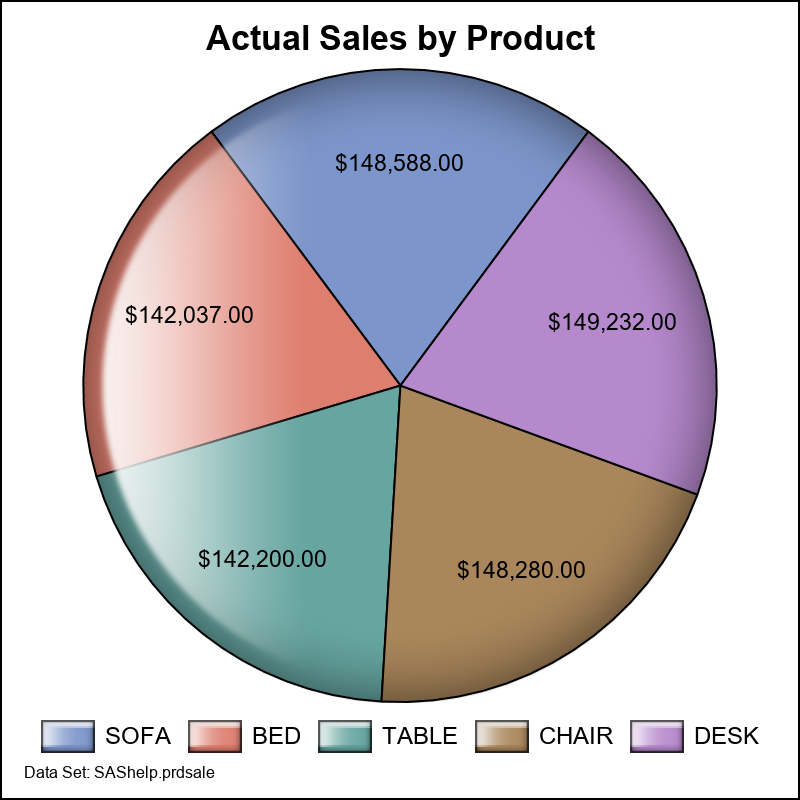
Allow setting group colors. Default skin is SHEEN, but this can be set to NONE or one of the other ones. In this Pie, I have set custom data colors.
Legends can be displayed at bottom or side. Legend chicklet sizes can be adjusted. When showing the category legend, the data in the pie slice can be changed.
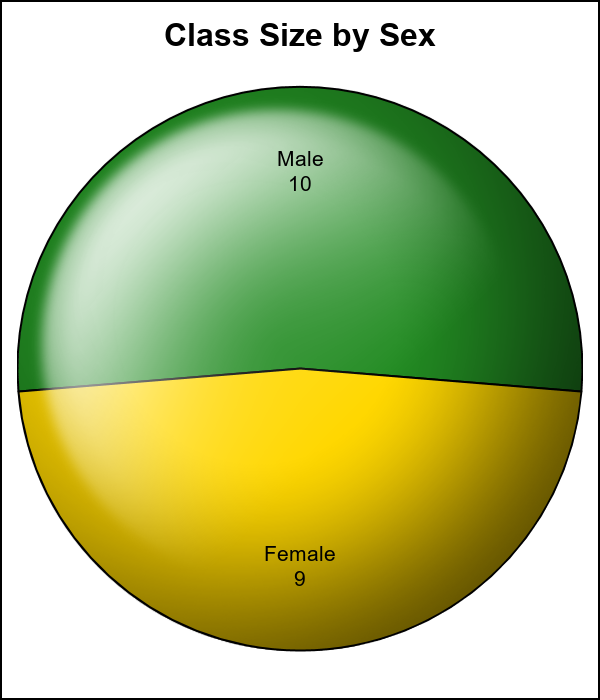
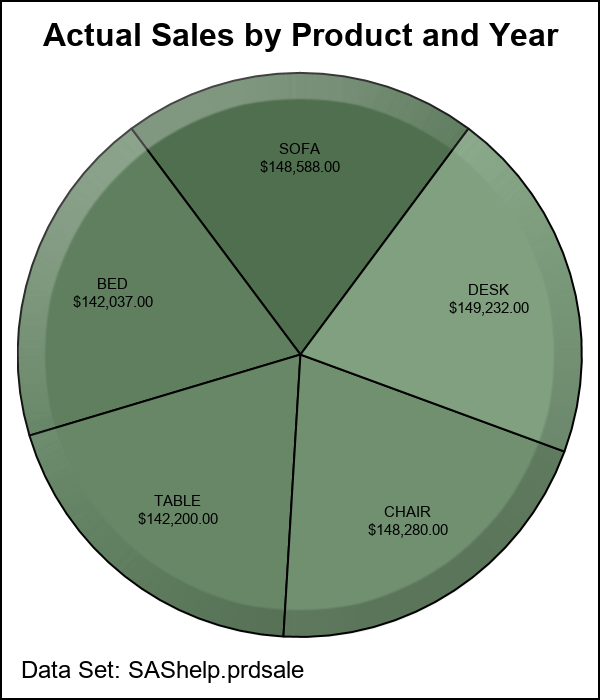
Colors can be set as graduated values to create different effects.
The %SGPIE macro has many features, including URL drill down for HTML output as shown below. The full code for the macro and the driver use cases are included in the files below. I hope you will find these useful.
%macro SGPIE (
Data=, /*--Data Set Name (Required)--*/
Category=, /*--Category Variable - Required--*/
Response=, /*--Response Variable - Optional--*/
Group=, /*--Group Variable - Optional--*/
URL=, /*--URL Variable - Optional--*/
CategoryLabel=True, /*--Include category value in slice label--*/
ResponseLabel=True, /*--Include response value in slice label--*/
PercentLabel=False, /*--Include percent value in slice label--*/
Legend=False, /*--Display Legend--*/
StartAngle=90, /*--Angle in degrees from East--*/
DataLabelLocation=Auto, /*--Data label location for slices--*/
Direction=CounterClockWise, /*--Pie Slices drawing direction--*/
DataSkin=Sheen, /*--Default data skin--*/
GroupGap=0, /*--Gap between group rings--*/
OtherSlice=True, /*--Group small values in one slice labeled "Other"--*/
GroupLabelFontSize=7, /*--Footnote Font Size--*/
DataLabelFontSize=8, /*--Footnote Font Size--*/
FootnoteFontSize=10, /*--Footnote Font Size--*/
TitleFontSize=12, /*--Title Font Size--*/
SubtitleFontSize=10, /*--Subtitle Font Size--*/
Footnote=, /*--Graph Footnote--*/
Footnote2=, /*--Graph Footnote--*/
Footnote3=, /*--Graph Footnote--*/
Title=, /*--Graph title2--*/
SubTitle=, /*--Graph Title--*/
Format=, /*--Format String--*/
LegendHalign=, /*--Horizontal position of legend--*/
LegendValign=, /*--Vertical position of legend--*/
LegendAcross=, /*--Number of columns--*/
LegendBorder=False, /*--Legend border--*/
DataLabelContent=, /*--Labels shown in the slice--*/
DataColors=, /*--Replacement data colors--*/
DrillTarget=_blank, /*--Drill down tartet--*/
CenterFirstSlice=True /*--Center the first slice on the start angle--*/
);
Apologies in advance for Macro coding that may be less than optimal. I am sure Warren would write much better macro code. But, you get the idea.
SGPie Macro code: SGPie
SGPie driver examples: SGPie_Run


2 Comments
Sanjay,
Why not just replace this 30-some parameter macro with a new PROC SGPIE?
In any case, whether SGPIE macro or PROC SGPIE,
why not support a legend that includes Category, Value, and Percent of Whole,
as provided in my previously published work
both for ODS Graphics GTL pies and SAS/GRAPH PROC GCHART pies?
As you know, The Primary Problem with Pie Charts is getting all of the slides fully labeled without some labels overlapping.
A full-function legend solves that problem.
And I always advocate ordering pie slices by size, in the spirit of my slogan "Show Them What's Important."
Ordering inevitably puts all of the small slices adjacent to each other,
which exacerbates The Primary Problem,
but a legend eliminates that.by eliminating the labels.
And the legend being ordered also helps to "Show Them What's Important."
Regards,
LeRoy
LeRoy Bessler PhD
Visual Data Insights™
Le_Roy_Bessler@wi.rr.com
Thanks, LeRoy for your excellent comments. The macro is published exactly because we cannot deliver a procedure at this time. Also, it provides ease of use for most users and exposes the user to the features that can be customized. The macro can be extended to provide the features you mention.