Many things in nature can be seen as chain reactions. When one action occurs, others follow suit. For example, atmospheric greenhouse gas levels are increasing, which leads to a warming of the oceans. As the oceans warm, weather and climate patterns across the globe are impacted because the amount of water vapor in the air changes. I used SAS Visual Analytics to create four visualizations that show how changes in our climate are affecting the oceans and the Arctic.
Oceans are getting warmer
The graph below, using data from the National Oceanic and Atmospheric Administration, depicts average global sea surface temperature anomalies from 1880-2015. The baseline on the graph is set to the average temperature from 1950-2000 to illustrate change. The warming trend has implications on sea levels.
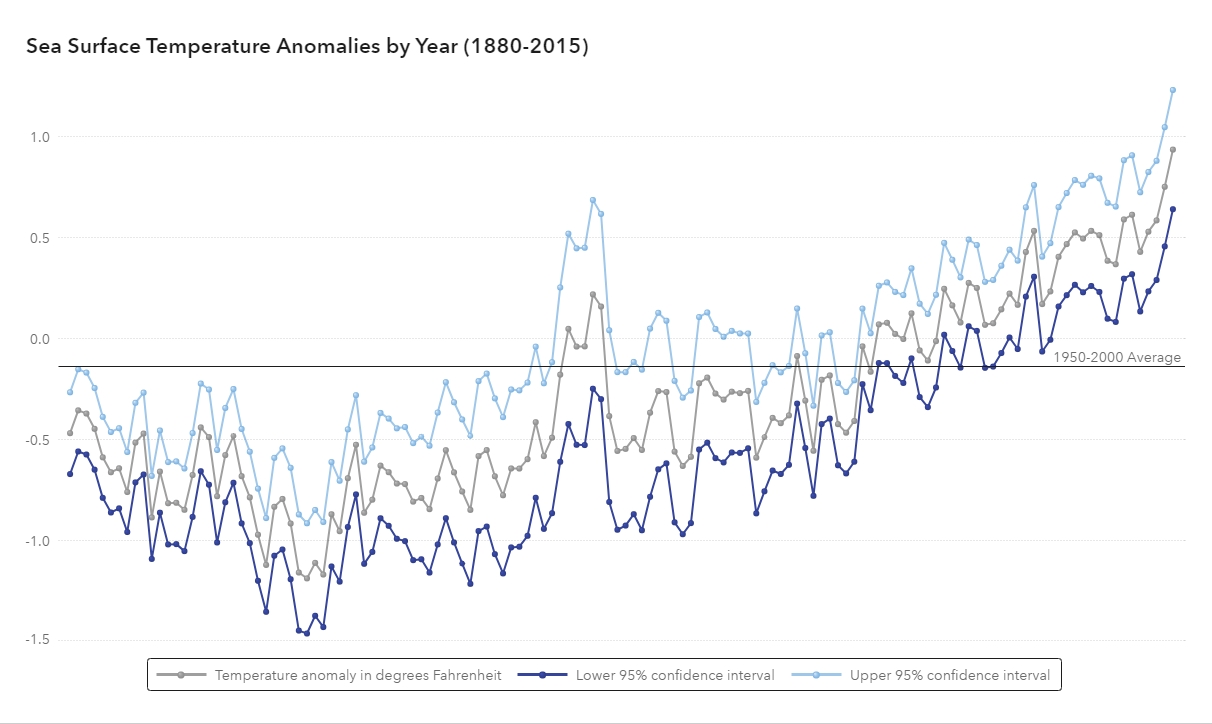
As sea water warms, it expands. Expanding sea water and the melting of sea ice and glaciers contribute to a rise in sea levels.
Sea levels are rising
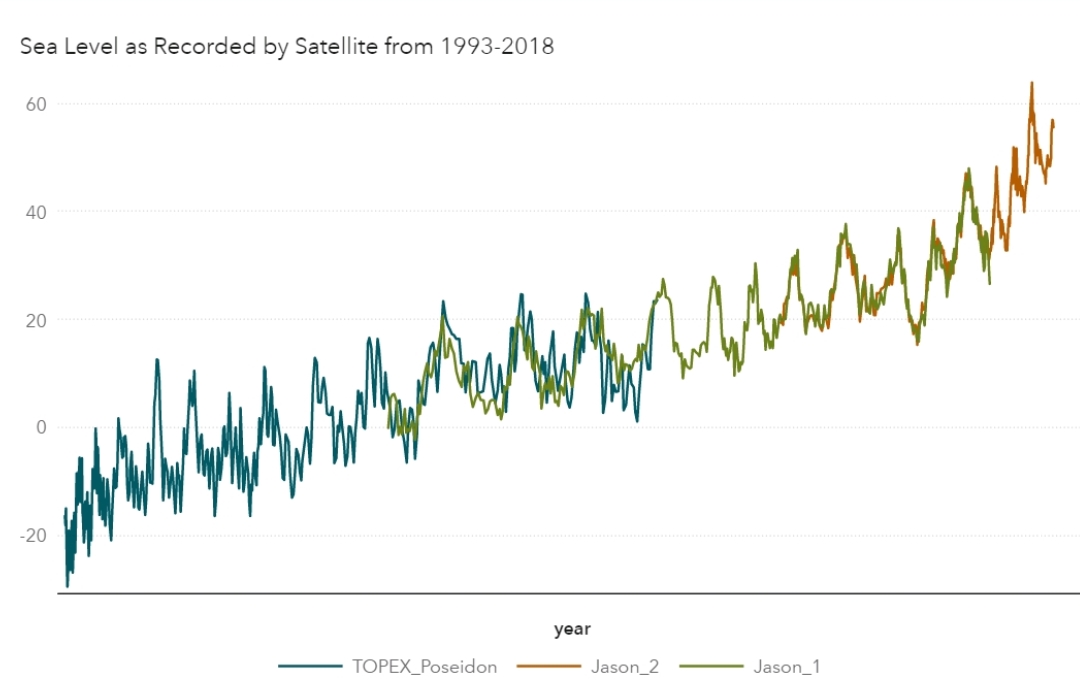
NASA collects information about sea level using satellites. The first satellite used to measure sea level was called TOPEX_Poseidon. It was launched in 1992 and collected data for 25 years. TOPEX_Poseidon was followed by the Jason-1 launched in 2001, Jason-2 launched in 2008, and Jason-3 launched in 2016. This graph shows sea level as recorded by TOPEX_Poseidon in teal, Jason_1 in green, and Jason_2 in orange. To read more about global sea level data, view this sea level resource from NASA.
Antarctic land ice sheets are melting
NASA also uses satellites to collect data about land ice sheet mass. Land ice includes mountain glaciers and ice sheets covering Greenland and Antarctica. Melting land ice sheets contribute significantly to rising sea levels. This graph shows the Antarctic land ice sheet mass variation in gigatonnes from 2002 to 2017. The data was captured by the Gravity Recovery and Climate Experiment twin satellites. The GRACE mission ended in 2017. Learn more about GRACE or learn more about ice sheets.

Arctic sea ice totals are decreasing
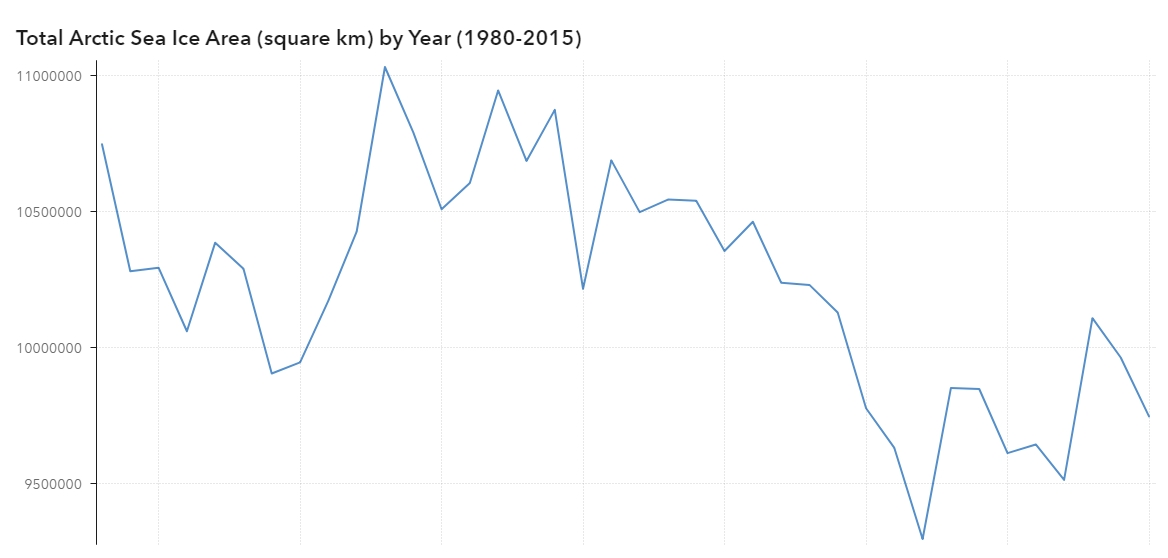
Arctic sea ice is frozen ocean water. Its entire lifecycle begins and ends in the ocean. Sea ice melts and freezes with the seasons. Because the surface of sea ice is bright, it reflects sunlight back into space. Without the sea ice to reflect sunlight back into space, the oceans absorb the sunlight and warm further. The graph below features data about total arctic sea ice area in square km from the National Snow and Ice Data Center.
Hear stories about climate change on the Global GoalsCast podcast
The The Global GoalsCast features a Green Miniseries focusing on Robert and Barney Swan. Robert Swan is the first man to walk to both the North and South Pole. He completed his first journey to the South Pole in 1986. During the North Pole trek in 1989, he and his team nearly drowned because of unseasonable melting of the Arctic sea ice.
In November 2017, Robert, accompanied by his son Barney, began another expedition to the South Pole. They dubbed this mission the South Pole Energy Challenge and vowed to complete the journey surviving solely on renewable energy. They successfully completed the journey on January 15, 2018.
During the trek, Robert noticed disturbing changes in the quality of the ice in Antarctica, which he feels is a concern that Antarctica is beginning to see the effects of climate change.
Listen to the Green Miniseries podcasts on the Global GoalsCast.