Ever since the Moneyball book & movie came out, athletes have been scrambling to use data and analytics to gain a competitive advantage. One of my favorite sports is boat racing - the ones you paddle. Follow along as I lead you through some maps and graphs I created for the big race coming up next month!
There are only a few 'big' paddling boat races in the US, and the Gorge Downwind Champs race, organized by Carter Johnson, is one of the biggest. Top paddlers from all over the world stay up late (depending on their time zone, of course) to sign up for the coveted race slots as soon as registration is open - and all the slots fill up quickly. The race is in the Columbia river, on the border between Oregon and Washington state in the northwest US. This is a unique area where the river is flowing to the west, and the wind is blowing to the east ... which creates waves in the river. Beginners find the waves challenging, while skillful seasoned paddlers actually ride the waves (upstream) to reach some incredible speeds.
Map
Let's start with the race course. There's an official page containing several satellite-image maps with important information annotated on them. Below is a copy of the overall map (and there are other maps zoomed-in to specific areas):

Not being familiar with the area, the map was a bit overwhelming, and difficult for me to get my bearings. So I decided to create a simplified map. I wrote some SAS code to download the 10 openstreetmap tiles for the race area, and used annotate commands to stitch the tiles together overlaid on a grid. I then annotated some triangular blue markers on the map to indicate the special points of interest, and red arrows showing the path of the race.
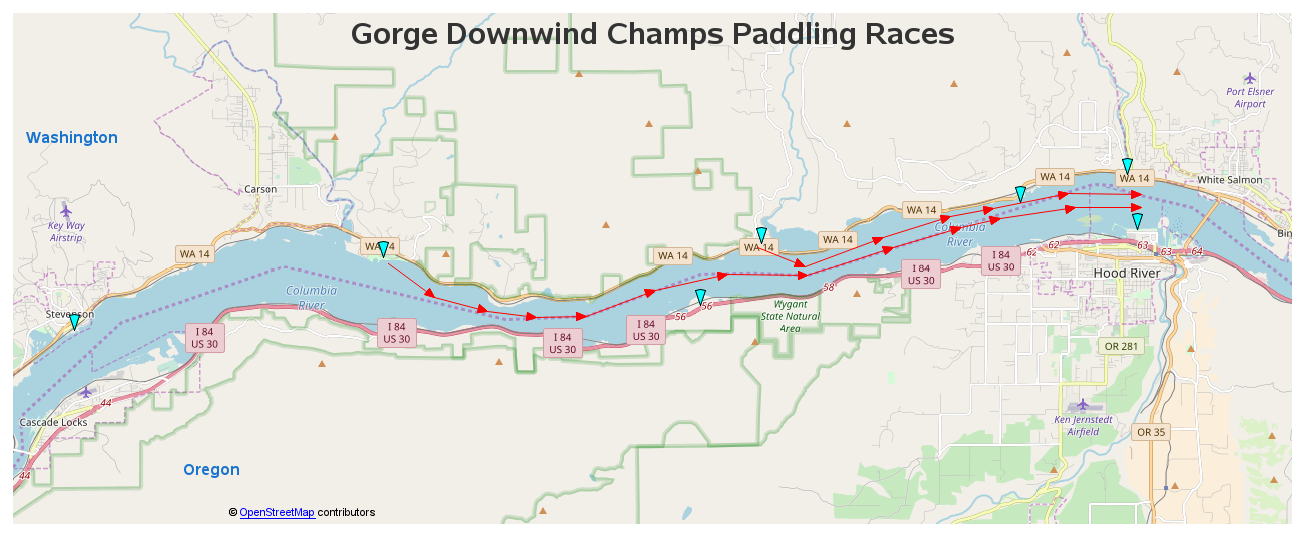
But I wasn't quite satisfied... It was difficult to distinguish my map markers and race-path from the background map. I wanted to de-emphasize the background map, and put the focus on the things I had added. Therefore I created a transparent white overlay to cover the background map, and inserted it between the map and my annotated markers. The transparent white layer makes the map more subdued, while leaving my markers at full-brightness (since they're printed on top of the transparent white). Now it's easy to see what you should be focusing on!
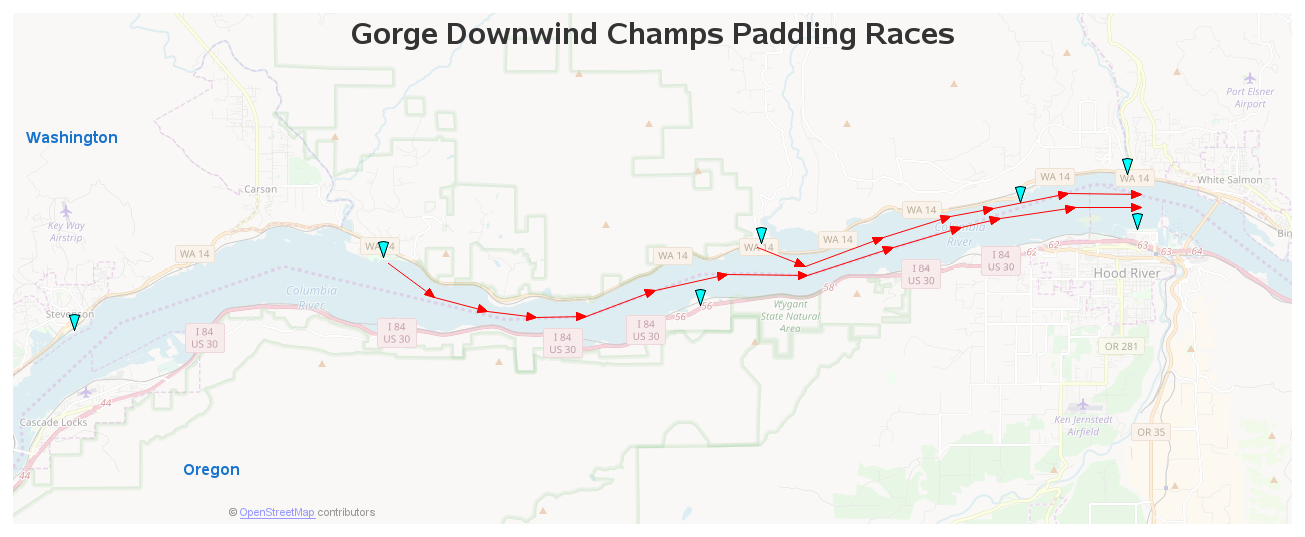
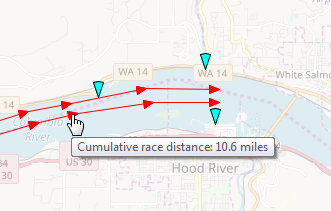
If you click the map image above, you can see the interactive version with mouse-over text and drilldowns. When you click the blue triangles, it will take you to the official race map of that area. And when you click the red arrows along race path, it will drilldown to a Google map zoomed-in on that exact spot. The mouse-over text for the red race path shows the approximate cumulative distance at each marker (calculated using the SAS geodist() function). And with this information, I now I know that the whole race is about 13 miles long.
Race Data
In preparation for the 2018 race, I figured the racers would want to see the previous year's data. It's available on the paddleguru website, in tabular form, such as the following:
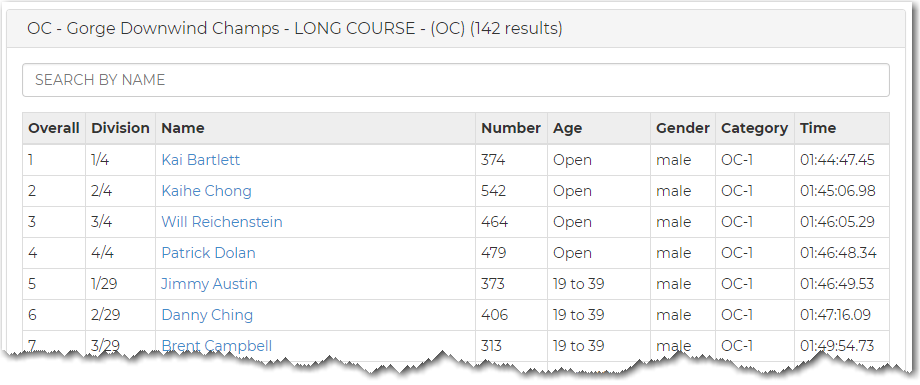
Tables are good if you're only interested in finding a few data values (such as the fastest racer, a specific racer's time, etc), but I assume the racers want more out of it. So I copy-n-pasted the data into a text file, and imported it into SAS where I could do some visual analytics. After trying several different graphing techniques, I decided I liked the following (this is just the top portion of the graph - click it to see the whole graph, which you can scroll up/down to see all the racers). I created separate graphs for several different categories of boats, etc.
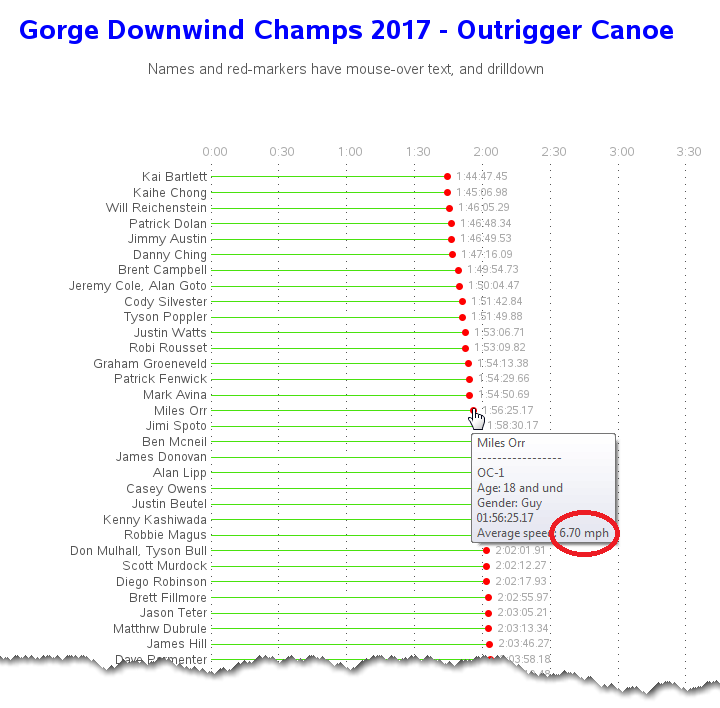
You can now easily compare the times of the racers visually (wow, those first six finishers were really close!). I also added mouse-over text, that shows more detailed information about each racer. One unique bit of information I added was the approximate average speed - I was able to do that by combining the estimated distance (from the map above) with the times (from the paddleguru website), to estimate an average miles-per-hour. Racers can compare the speed estimates to the speeds from their practice sessions, to get a general idea of how competitive they might be.
Bets?
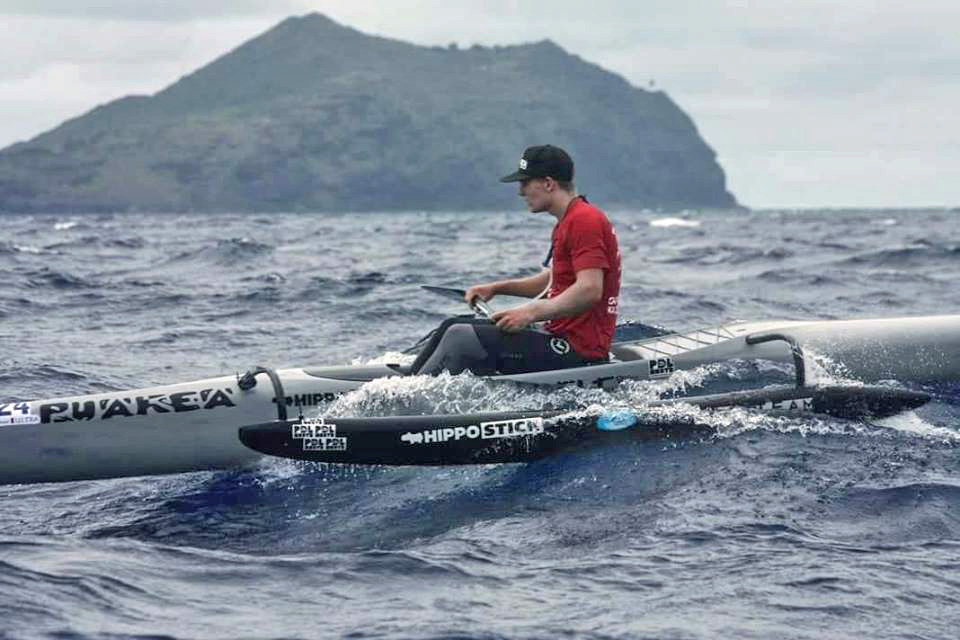
Who am I cheering for in the race? ... Of course that would be Harrison Deisroth! He's a local guy from North Carolina (moved to Hawaii this past winter), and he earned the title Junior World Champion at a recent race in Hawaii. He's gonna be hard to beat in the "18 and Under" age group, and he's gonna give most of the over-18 paddlers a run for their money too. Here's a picture of him catching a bump in an OC1 (outrigger canoe). Good luck in the upcoming race!