On using the range to estimate the variability of small samples

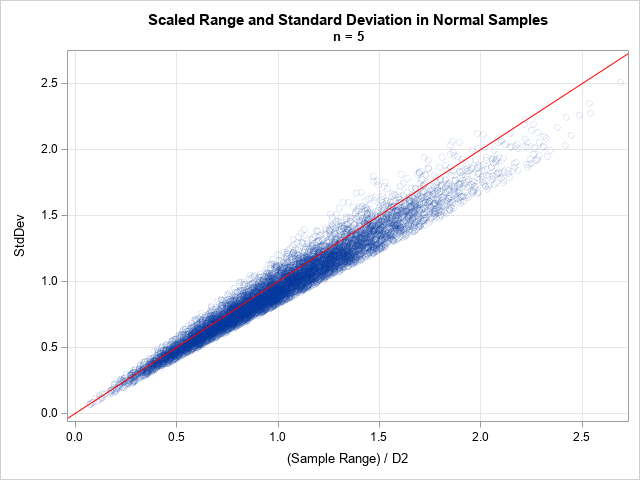
In statistical quality control, practitioners often estimate the variability of products that are being produced in a manufacturing plant. It is important to estimate the variability as soon as possible, which means trying to obtain an estimate from a small sample. Samples of size five or less are not uncommon