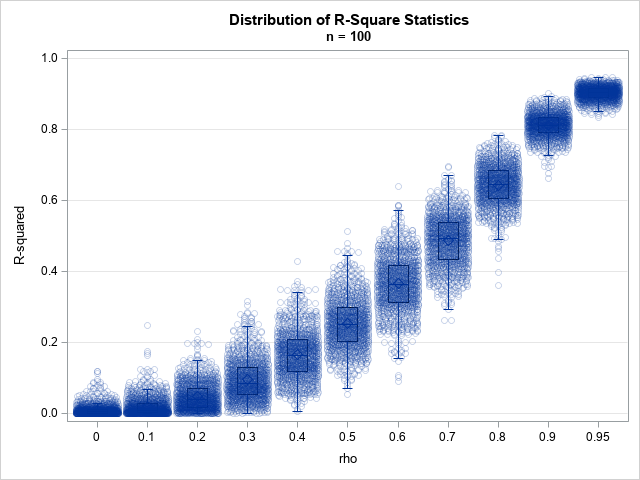
I was on vacation when a family member sidled up to me. "Rick, you're a statistician..." he began. I knew I was in trouble. He proceeded to tell me the story of Joseph "Newsboy" Moriarty, a New Jersey mobster who rose to prominence and became known as the bookie who
Author
Statistical programmers often need mathematical constants such as π (3.14159...) and e (2.71828...). Programmers of numerical algorithms often need to know machine-specific constants such as the machine precision constant (2.22E-16 on my Windows PC) or the largest representable double-precision value (1.798E308 on my Windows PC). Some computer languages build these
I encountered a wonderful survey article, "Robust statistics for outlier detection," by Peter Rousseeuw and Mia Hubert. Not only are the authors major contributors to the field of robust estimation, but the article is short and very readable. This blog post walks through the examples in the paper and shows
In my recent article on simulating Buffon's needle experiment, I computed the "running mean" of a series of values by using a single call to the CUSUM function in the SAS/IML language. For example, the following SAS/IML statements define a RunningMean function, generate 1,000 random normal values, and compute the
Once again I rediscovered something that I once knew, but had forgotten. Fortunately, this blog is a good place to share little code snippets that I don't want to forget. I needed to compute the diagonal elements of a product of two matrices. In symbols, I have an nxp matrix,
The SAS/IML READ statement has a few convenient features for reading data from SAS data sets. One is that you can read all variables into vectors of the same names by using the _ALL_ keyword. The following DATA steps create a data set called Mixed that contains three numeric and
A recent question on a SAS Discussion Forum was "how can you overlay multiple kernel density estimates on a single plot?" There are three ways to do this, depending on your goals and objectives. Overlay different estimates of the same variable Sometimes you have a single variable and want to
It is "well known" that the pairwise deletion of missing values and the resulting computation of correlations can lead to problems in statistical computing. I have previously written about this phenomenon in my article "When is a correlation matrix not a correlation matrix." Specifically, consider the symmetric array whose elements
In my article on Buffon's needle experiment, I showed a graph that converges fairly nicely and regularly to the value π, which is the value that the simulation is trying to estimate. This graph is, indeed, a typical graph, as you can verify by running the simulation yourself. However, notice
In the R programming language, you can use a negative index in order to exclude an element from a list or a row from a matrix. For example, the syntax x[-1] means "all elements of x except for the first." In general, if v is a vector of indices to
Buffon's needle experiment for estimating π is a classical example of using an experiment (or a simulation) to estimate a probability. This example is presented in many books on statistical simulation and is famous enough that Brian Ripley in his book Stochastic Simulation states that the problem is "well known
Hello, 2012! It's a New Year and I'm flushed with ideas for new blog articles. (You can also read about The DO Loop's most popular posts of 2011.) The fundamental purpose of my blog is to present tips and techniques for writing efficient statistical programs in SAS. I pledge to
At the beginning of 2011, I made four New Year's resolutions for my blog. As the year draws to a close, it's time to see how I did: Resolution: 100 blog posts in 2011: Completed. I blew by this goal by posting 165 articles. I recently compiled a list of
A few colleagues and I were exchanging short snippets of SAS code that create Christmas trees and other holiday items by using the SAS DATA step to arrange ASCII characters. For example, the following DATA step (contributed by Udo Sglavo) creates a Christmas tree with ornaments and lights: data _null_;
Since this is a blog about statistical programming and analysis, I am always looking for data to analyze. As 2011 ends, I look back on the 165 blog entries that I published since 01JAN2011. This article presents the 10 most popular posts, as determined by the number of people who
The SAS Output Delivery System (ODS) enables you to manage and customize tables (and graphics!) that are created by SAS procedures. I like to use the ODS SELECT statement to display only part of the output of a SAS procedure. For example, the UNIVARIATE procedure produces five tables by default,
Some SAS products such as SAS/IML Studio (which is included FREE as part of SAS/IML software) have interactive graphics. This makes it easy to interrogate a graph to determine values of "hidden" variables that might not appear in the graph. For example, in a scatter plot in SAS/IML Studio, you
Yesterday, December 7, 1941, a date which will live in infamy... - Franklin D. Roosevelt Today is the 70th anniversary of the Japanese attack on Pearl Harbor. The very next day, America declared war. During a visit to the Smithsonian National Museum of American History, I discovered the results of
In simulation studies, the response variable is often a binary (or Bernoulli) variable. Often 1 is used to indicate "success" (or the occurrence of an event) whereas 0 indicates "failure" (or the absence of an event). For example, the following SAS/IML statements define a vector x of zeros and ones:
Recently the "SAS Sample of the Day" was a Knowledge Base article with an impressively long title: Sample 42165: Using a stored process to eliminate duplicate values caused by multiple group memberships when creating a group-based, identity-driven filter in SAS® Information Map Studio "Wow," I thought. "This is the longest
The other day someone posted the following question to the SAS-L discussion list: Is there a SAS PROC out there that takes a multi-category discrete variable with character categories and converts it to a single numeric coded variable (not a set of dummy variables) with the character categories assigned as
I got an email asking the following question: In the following program, I don't know how many variables are in the data set A. However, I do know that the variable names are X1–Xk for some value of k. How can I read them all into a SAS/IML matrix when
I have previously written about how to create funnel plots in SAS software. A funnel plot is a way to compare the aggregated performance of many groups without ranking them. The groups can be states, counties, schools, hospitals, doctors, airlines, and so forth. A funnel plot graphs a performance metric
Here's a quick tip to keep in mind when you write SAS/IML programs: although the SAS/IML documentation lists about 300 functions that are built into the SAS/IML language, you can also call hundreds of functions in Base SAS. Furthermore, you can pass in SAS/IML vectors for arguments to the functions.
Halloween night was rainy, so many fewer kids knocked on the door than usual. Consequently, I'm left with a big bucket of undistributed candy. One evening as I treated myself to a mouthful of tooth decay, I chanced to open a package of Wonka® Bottle Caps. The package contained three
Did you know that you can define "abbreviations" in the SAS enhanced editor? These handy little shortcuts can save you a lot of typing. For example, I have an abbreviation for the string _iml. Whenever I type _iml, the editor prompts me to replace those four characters with the following
Here is a little trick to file away. Given a row vector of zeros and ones, thought of as representing a number in base 2, the following SAS/IML statements compute the decimal value of that vector. proc iml; x = {1 0 0 1 1 1}; /* number in base
One aspect of blogging that I enjoy is getting feedback from readers. Usually I get statistical or programming questions, but every so often I receive a comment from someone who stumbled across a blog post by way of an internet search. This morning I received the following delightful comment on
If you want to extract values from a SAS/IML vector, use the subscripting operation, such as in the following example: proc iml; x = {A B C D E}; y = x[{1 2 3}]; /* {A,B,C} */ The vector y contains the first three elements of x. However, did you
Sometimes you want to label only certain observations in a plot. This is useful in many ways, but one use is to label outliers on a scatter plot. In the SGPLOT procedure, the DATALABEL= option enables you to specify the name of a variable that is used to label observations.