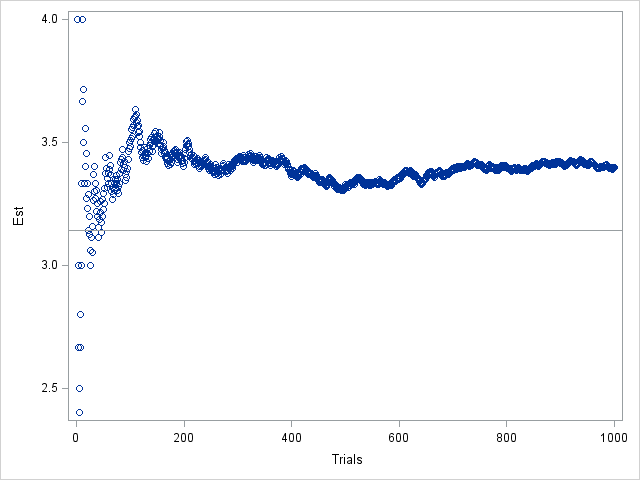
In my article on Buffon's needle experiment, I showed a graph that converges fairly nicely and regularly to the value π, which is the value that the simulation is trying to estimate. This graph is, indeed, a typical graph, as you can verify by running the simulation yourself.
However, notice that the graph dips down to about π after about 300 iterations before increasing. This means that you could cheat. You could run the simulation for about 300 iterations and proclaim "Look how well this method does! And it only took 300 iterations!" In fact, if you use exactly 321 iterations, the estimate for π is 3.145, which is pretty close to the true value.
Here's another way you can cheat with this simulation: change the random number seed. Suppose that you wanted to cast doubt on this method of estimating π. You could change the random number seed and rerun the program until you get a result that appears to a horrible estimate. For example, if you rerun the program with the random number seed 12345 (that is, call randseed(12345)), the graph is the following:
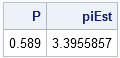
Not only is the estimate for N=1000 far from π, but the graph looks like it has converged to an entirely different value. If you are developing the algorithm and you see the previous graph, you might erroneously think that there is a bug in your program.
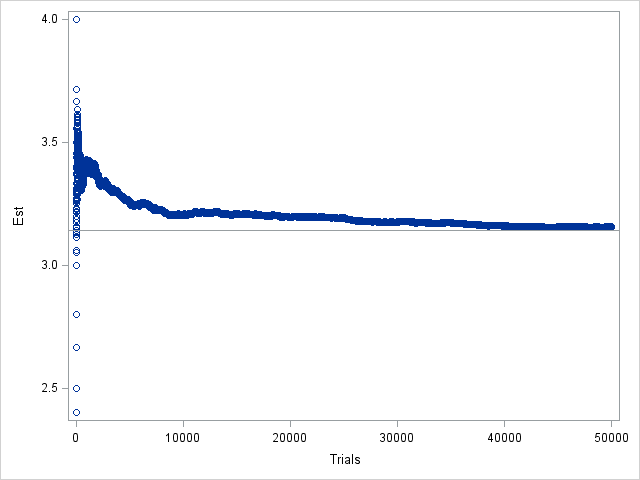
Of course, if you run the program for, say, 50000 iterations, you will see that the graph does eventually converge to the value π, as shown in the following graph that uses the same "bad" seed:
These graphs tell an important cautionary tale and remind us that samples—even simulated samples!—contain sampling variability. Therefore, be cautious of claims that are based on a single run of a simulation. Also, when you write a simulation, you should occasionally change the random number seed, just to see how the seed affects the simulation.
Another conclusion to draw is that it is important to know the variance of your estimator. Brian Ripley in his book Stochastic Simulation (1987, p. 194) shows that the variance of this estimator is approximated by 5.63/N, which is quite large. A 95% confidence interval for the parameter is Estimate ± 1.96 sqrt(5.63/N), which means that about 200,000 iterations are required to achieve an estimate that is probably within ±0.01 of π. (With 200,000 iterations, the estimate with the seed 12345 is 3.1475.)
By the way, there are other "Buffon's needle estimators" that correspond to different experimental conditions and that have smaller variance, but, nevertheless, "because of the convergence rate 1/sqrt(N), Monte Carlo methods are ... not a serious way to determine π" (Ripley, p. 197).
So, next time that someone else shows you the results of a simulation, make two requests:
- Ask to see several runs with different initial seeds. This is easily done by changing the random seed to 0, which means that the random number generator is initialized by the system time.
- Try to determine the variance of the estimator so that you can compute the Monte Carlo standard error. This enables you to calculate the number of iterations that you need in order to estimate a parameter to within a certain tolerance. However, the number of iterations is based on a 95% confidence interval, so there is no guarantee.

8 Comments
Indeed a nice illustration of sampling variability. How long did it take you to find the bad seed :) Maybe I should rather ask how you found this seed...
I probably looked at a dozen seeds before I found one I liked.
I assume that you know that an Italian mathematician by the name of Lazzarini published in the early twentieth century an estimate of pi that he claimed to have obtained from a Buffon’s needle experiment with 3408 needle drops and getting the estimate pi ~ 355/113 (which is a well-known rational approximation). If he had done one more drop, then irrespective of what the outcome was, his estimate would have been much worse. This has been cited as a well-known case of academic cheating.
Can we run a few tests based on different seeds and average the results, like bootstrapping?
Yes, and that's called Monte Carlo simulation. Rather than use a single series of size N, you generate B samples of the same size. Each sample leads to an estimate of some quantity. The union of the estimates approximates the sampling distribution of the estimator, and the average of the estimates is a quantity called the Monte Carlo estimate.
Cool! Finally understand Monte Carlo simulation. Thanks a lot.
Pingback: Monte Carlo estimates of pi and an important statistical lesson - The DO Loop
The title reminds me of a great book that I recommend, How to Lie with Statistics by Darrell Huff. Related, and also excellent, is Statistics Done Wrong: The Woefully Complete Guide by Alex Reinhart.