In a previous blog post on robust estimation of location, I worked through some of the examples in the
survey article, "Robust statistics for outlier detection," by Peter Rousseeuw and Mia Hubert.
I showed that SAS/IML software and PROC UNIVARIATE both support the robust estimators of location that are mentioned in the paper. Today's post looks at the robust estimators of scale that are mentioned in the same paper and works through more examples in the paper. The paper uses the following five measurements, which contain one outlier:
6.25, 6.27, 6.28, 6.34, 63.1
Robust scale statistics in SAS/IML software
SAS/IML software contains several functions for robust estimation of scale. For estimating scale, the MAD function is often used. The MAD statistic is an acronym for "median of all absolute deviations from the median." The MAD statistic is often multiplied by a constant in order to make it unbiased for data that are normally distributed. The constant is 1.483, but you don't need to remember that value because the MAD function has the "NMAD" option that automatically includes the multiplication factor, as shown in the following example:
proc iml;
x = {6.25, 6.27, 6.28, 6.34, 63.1};
mad = mad(x, "NMAD");
print mad; |

Rousseeuw and Hubert briefly mention two other robust measures of scale: the Qn estimator (Rousseeuw and Croux, JASA, 1993) and the interquartile range (IQR), which is well-known from the Tukey box plot. You can compute both of these estimators in SAS/IML software, as follow:
Qn = mad(x, "QN");
call qntl(q, x, {0.25 0.75}); /* compute 25th and 75th percentile */
IQR = q[2] - q[1];
print Qn IQR; |
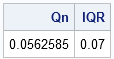
The three robust estimates of scale are similar. They range from 0.04 (MAD) to 0.07 (IQR). The IQR is sometimes divided by 1.349 in order to estimate the scale of normally distributed data. If you divide 0.07 by 1.349, you get 0.052, which make the estimates even more similar.
The connection with outlier detection
All this discussion of robust estimation of location and scale is closely related to detecting outliers. In practice, outliers are often detected using a rule or formula. The classical rule is to compute z-scores, which are just the normalized values zi = (xi - x̄)/s, where x̄ is the sample mean and s is the sample standard deviation. An outlier is defined as any observation for which |zi| exceeds some cutoff value, typically 2.5 or 3.
This rule fails when there is a large outlier in the data. For example, the following SAS/IML statements compute the classical z-scores for the Rousseeuw and Hubert example:
/* rules to detect outliers */ z = (x - mean(x)) / std(x); print z; |
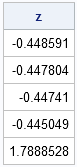
Because the mean and standard deviation are both influenced by the outlier, no observation has a large z-score, and therefore none is flagged as an outlier. However, using robust estimators in the z-score formula does successfully identify the outlier, as shown in the following statements:
zRobust = (x - median(x)) / mad(x, "NMAD"); print zRobust; |
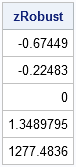
The outlier has a HUGE "robust score." Of course, you don't have to print out the scores and inspect them. The following SAS/IML statements use the LOC function (the most useful function that you've never heard of!) to find all of the data for which the robust z-score exceeds 2.5, and prints only the outliers:
outIdx = loc(abs(zRobust)>2.5); if ncol(outIdx)>0 then outliers = x[outIdx]; else outliers = .; print outliers; |

Robust Estimates in the UNIVARIATE Procedure
The UNIVARIATE procedure also supports robust estimates of scale. The ROBUSTSCALE option on the PROC UNIVARIATE statement computes the robust estimates in the Rousseeuw and Hubert article, as well as others. The documentation for the UNIVARIATE procedure includes a section that describes the robust estimates of scale. The following example computes robust estimates of scale:
data a; input x @@; datalines; 6.25 6.27 6.28 6.34 63.1 ; proc univariate data=a robustscale; var x; ods select RobustScale; run; |
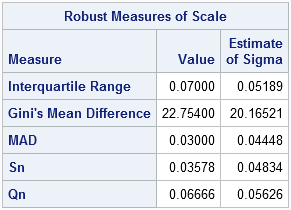
Notice that the output from PROC UNIVARIATE includes two columns. The first column is an unadjusted robust estimate. The second column estimates the standard deviation for normally distributed data, which can be derived from the first column.

6 Comments
I want to ask, is there any procedure for unreplicated two level unreplicated factorial design using three robust scale estimators proposed by Lenth, Dong and Berk&Picard? since i want to compare the performance using these methods in design of experiments..Thank you..
A quick internet search shows that those references are cited in the documentation for ADX Interface for Design of Experiments, so I'd look there.
Pingback: Detecting outliers in SAS: Part 1: Estimating location - The DO Loop
Pingback: The Theil-Sen robust estimator for simple linear regression - The DO Loop
Pingback: Nonstandard ways to standardize variables - The DO Loop
Pingback: Why are some dispersion statistics re-scaled? - The DO Loop