Modern statistical software provides many options for computing robust statistics. For example, SAS can compute robust univariate statistics by using PROC UNIVARIATE, robust linear regression by using PROC ROBUSTREG, and robust multivariate statistics such as robust principal component analysis. Much of the research on robust regression was conducted in the 1970s, so I was surprised to learn that a robust version of simple (one variable) linear regression was developed way back in 1950! This early robust regression method uses many of the same techniques that are found in today's "modern" robust regression methods. This article describes and implements a robust estimator for simple linear regression that was developed by Theil (1950) and extended by Sen (1968).
The Theil-Sen robust estimator
I had not heard of the Theil-Sen robust regression method until recently, perhaps because it applies only to one-variable regression. The Wikipedia article about the Theil-Sen estimator states that the method is "the most popular nonparametric technique for estimating a linear trend" in the applied sciences due to its "simplicity in computation, ... robustness to outliers," and "[limited assumptions]regarding measurement errors."
The idea behind the estimator is simple. If the data contains N pairs of (x, y) values, compute all the slopes between pairs of points and choose the median as the estimate of the regression slope. Using that slope, pass a line through each pair of (x,y) values to obtain N intercepts. Choose the median of the intercepts as the estimate of the regression intercept.
That's it. You compute "N choose 2" (which is N*(N-1)/2) slopes and take the median. Then compute N intercepts and take the median. The slope estimate is unbiased and the process is resistant to outliers.
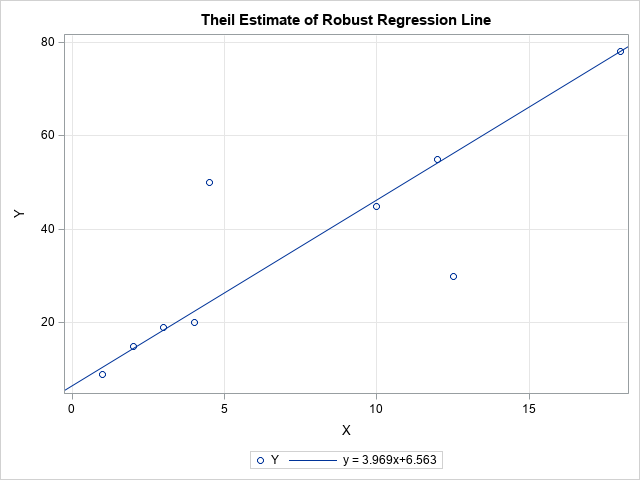
The adjacent scatter plot shows the Theil-Sen regression line for nine data points. The seven data points that appear to fall along the regression line were used by Sen (1968). I added two outliers. The plot shows that the Theil-Sen regression line ignores the outliers and passes close to the other data points. The slope of the Theil-Sen line is slightly less than 4. In contrast, the least squares line through these data has a slope of only 2.4 because of the influence of the two outliers.
Implement the Theil-Sen estimator in SAS
You can easily implement Theil-Sen regression in SAS/IML, as follows:
- Use the ALLCOMB function to generate all pairs of the values {1, 2, ..., N}. Or, for large N, use the RANDCOMB function to sample pairs of values.
- Use subscript operations to extract the pairs of points. Compute all slopes between the pairs of points.
- Use the MEDIAN function to compute the median slope and the median intercept.
The following SAS/IML program implements this algorithm. The program is very compact (six statements) because it is vectorized. There are no explicit loops.
proc iml; XY = {1 9, 2 15, 3 19, 4 20, 10 45, 12 55, 18 78, /* 7 data points used by Sen (1968) */ 12.5 30, 4.5 50}; /* 2 outliers (not considered by Sen) */ /* Theil uses all "N choose 2" combinations of slopes of segments. Assume that the first coordinates (X) are distinct */ c = allcomb(nrow(XY), 2); /* all "N choose 2" combinations of pairs */ Pt1 = XY[c[,1],]; /* extract first point of line segments */ Pt2 = XY[c[,2],]; /* extract second point of line segments */ slope = (Pt1[,2] - Pt2[,2]) / (Pt1[,1] - Pt2[,1]); /* Careful! Assumes x1 ^= x2 */ m = median(slope); b = median( XY[,2] - m*XY[,1] ); /* median(y-mx) */ print (b||m)[c={'Intercept' 'Slope'} L="Method=Theil Combs=All"]; |
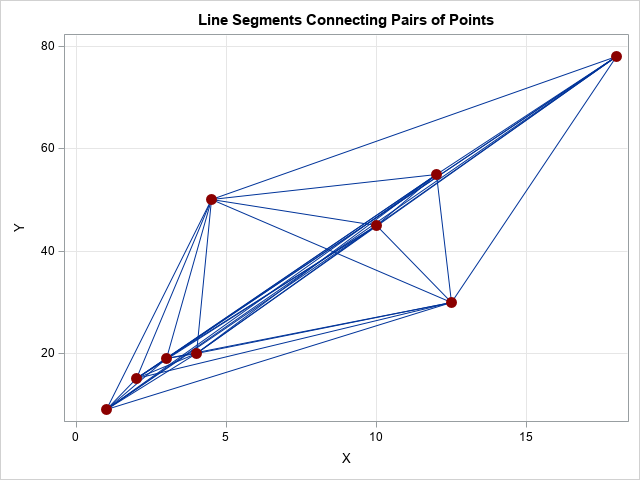
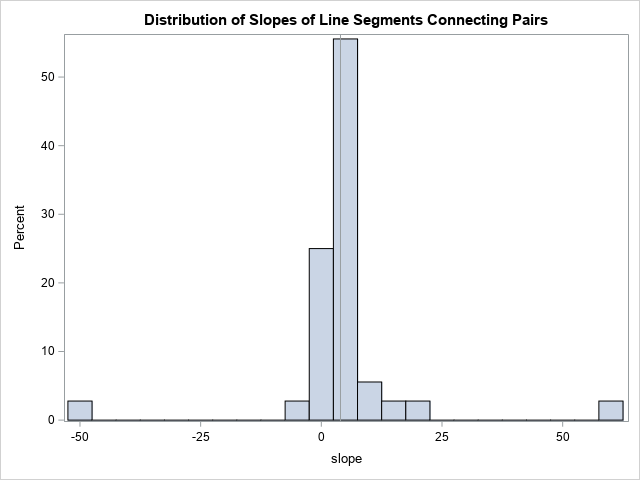
As stated earlier, the Theil-Sen estimate has a slope of 3.97. That value is the median of the slopes among the 36 line segments that connect pairs of points. The following graphs display the 36 line segments between pairs of points and a histogram of the distribution of the slopes. The histogram shows that the value 3.97 is the median value of the distribution of slopes.
Handling repeated X values: Sen's extension
The observant reader might object that the slopes of the line segments will be undefined if any of the data have identical X values. One way to deal with that situation is to replace the undefined slopes by large positive or negative values, depending on the sign of the difference between the Y values. Since the median is a robust estimator, adding a few high and low values will not affect the computation of the median slope. Alternatively, Sen (1968) proved that you can omit the pairs that have identical X values and still obtain an unbiased estimate. In the following SAS/IML program, I modified the X values of the two outliers so that only seven of the nine X values are unique. The LOC function finds all pairs that have different X values, and only those pairs are used to compute the robust regression estimates.
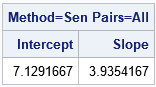
/* Sen (1968) handles repeated X coords by using only pairs with distinct X */ XY = {1 9, 2 15, 3 19, 4 20, 10 45, 12 55, 18 78, 12 30, 4 50}; /* last two obs are repeated X values */ c = allcomb(nrow(XY), 2); /* all "N choose 2" combinations of pairs */ Pt1 = XY[c[,1],]; /* first point of line segments */ Pt2 = XY[c[,2],]; /* second point of line segments */ idx = loc(Pt1[,1]-Pt2[,1]^=0); /* find pairs with same X value */ Pt1 = Pt1[idx,]; /* keep only pairs with different X values */ Pt2 = Pt2[idx,]; slope = (Pt1[,2] - Pt2[,2]) / (Pt1[,1] - Pt2[,1]); m = median(slope); b = median( XY[,2] - m*XY[,1] ); /* median(y-mx) */ print (b||m)[c={'Intercept' 'Slope'} L="Method=Sen Combs=All"]; |
A function to compute the Theil-Sen estimator
The following function defines a SAS/IML function that implements the Theil-Sen regression estimator. I added two options. You can use the METHOD argument to specify how to handle pairs of points that have the same X values. You can use the NUMPAIRS option to specify whether to use the slopes of all pairs of points or whether to use the slopes of K randomly generated pairs of points.
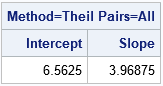
proc iml; /* Return (intercept, slope) for Theil-Sen robust estimate of a regression line. XY is N x 2 matrix. The other arguments are: METHOD: If method="Theil" and a pair of points have the same X coordinate, assign a large positive value instead of +Infinity and a large negative value instead of -Infinity. If method="Sen", omit any pairs of points that have the same first coordinate. NUMPAIRS: If numPairs="All", generate all "N choose 2" combinations of the N points. If numPairs=K (positive integer), generate K random pairs of points. */ start TheilSenEst(XY, method="SEN", numPairs="ALL"); Infinity = 1e99; /* big value for slope instead of +/- infinity */ if type(numPairs)='N' then c = rancomb(nrow(XY), 2, numPairs); /* random combinations of pairs */ else if upcase(numPairs)="ALL" then c = allcomb(nrow(XY), 2); /* all "N choose 2" combinations of pairs */ else stop "ERROR: The numPairs option must be 'ALL' or a postive integer"; Pt1 = XY[c[,1],]; /* first points for slopes */ Pt2 = XY[c[,2],]; /* second points for slopes */ dy = Pt1[,2] - Pt2[,2]; /* change in Y */ dx = Pt1[,1] - Pt2[,1]; /* change in X */ idx = loc( dx ^= 0 ); if upcase(method) = "SEN" then do; /* exclude pairs with same X value */ slope = dy[idx] / dx[idx]; /* slopes of line segments */ end; else do; /* assign big slopes for pairs with same X value */ slope = j(nrow(Pt1), 1, .); /* if slope calculation is 0/0, assign missing */ /* Case 1: x1 ^= x2. Do the usual slope computation */ slope[idx] = dy[idx] / dx[idx]; /* Case 2: x1 = x2. Assign +Infinity if sign(y1-y2) > 0, else assign -Infinity */ jdx = loc( dx = 0 & sign(dy)>0 ); if ncol(jdx)>0 then slope[jdx] = Infinity; jdx = loc( dx = 0 & sign(dy)<0 ); if ncol(jdx)>0 then slope[jdx] = -Infinity; end; m = median(slope); b = median( XY[,2] - m*XY[,1] ); /* median(y-mx) */ return( b || m ); finish; /* Test all four calls */ XY = {1 9, 2 15, 3 19, 4 20, 10 45, 12 55, 18 78, 18 30, 4 50}; /* last two obs are outliers not considered by Sen */ est = TheilSenEst(XY, "Theil", "All"); print est[c={'Intercept' 'Slope'} L="Method=Theil; Pairs=All"]; est = TheilSenEst(XY, "Sen", "All"); print est[c={'Intercept' 'Slope'} L="Method=Sen; Pairs=All"]; call randseed(123, 1); est = TheilSenEst(XY, "Theil", 200); print est[c={'Intercept' 'Slope'} L="Method=Theil; Pairs=200"]; call randseed(123, 1); est = TheilSenEst(XY, "Sen", 200); print est[c={'Intercept' 'Slope'} L="Method=Sen; Pairs=200"]; QUIT; |
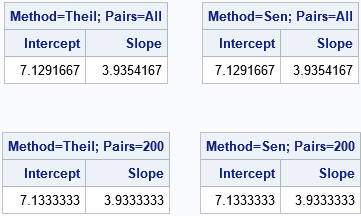
For these data, the estimates are the same whether you exclude pairs of points that have identical X coordinates or whether you replace the undefined slopes with large values. For this small data set, there is no reason to use the randomly chosen pairs of points, but that syntax is shown for completeness. Of course, if you run the analysis with a different random number seed, you will get a different estimate.
Summary
You can download the SAS program that creates the analysis and graphs in this article.
Although Theil published the main ideas for this method in 1950, it contains many of the features of modern robust statistical estimates. Specifically, a theme in modern robust statistics is to exhaustively or randomly choose many small subsets of the data. You compute a (classical) estimate on each subset and then use the many estimates to obtain a robust estimate. I did not realize that Theil had introduced these basic ideas almost seventy years ago!
Theil and Sen also included confidence intervals for the estimates, but I have not included them in this brief article.
References
- Sen, P. K. (1968) "Estimates of the regression coefficient based on Kendall's tau." JASA, 1379-1389.
- Theil, H. (1950) "A rank-invariant method of linear and polynomial regression analysis." Reprinted in 1992 in Henri Theil’s contributions to economics and econometrics, Springer, 345-381.

2 Comments
Have you developed an iml function that will also return confidence intervals or a significance test?
I haven't, but it shouldn't be hard. Do you have a reference? IF you don't, you can always use bootstrap CIs.