I encountered a wonderful survey article, "Robust statistics for outlier detection," by Peter Rousseeuw and Mia Hubert. Not only are the authors major contributors to the field of robust estimation, but the article is short and very readable. This blog post walks through the examples in the paper and shows how to compute each example by using SAS. In particular, this post shows how to compute robust estimates of location for univariate data. Future posts will show how to compute robust estimates of scale and multivariate estimates.
The Rousseeuw and Hubert article begins with a quote:
In real data sets, it often happens that some observations are different from the majority. Such observations are called outliers. ...They do not fit the model well. It is very important to be able to detect these outliers.
The quote explains why outlier detection is connected to robust estimation methods. Classical statistical estimators are so affected by the outliers that "the resulting fitted model does not allow [you]to detect the deviating observations." The goal of robust statistical methods is to "find a fit that is close to the fit [you]would have found without the [presence of]outliers." You can then identify the outliers by their large deviation from the robust model.
The simplest example is computing the "center" of a set of data, which is known as estimating location. Consider the following five measurements:
6.25, 6.27, 6.28, 6.34, 63.1
As the song says, one of these points is not like the other.... The last datum is probably a miscoding of 6.31.
Robust estimate of location in SAS/IML software
SAS/IML software contains several functions for robust estimation. For estimating location, the MEAN and MEDIAN functions are the primary computational tools. It is well known that the mean is sensitive to even a single outlier, whereas the median is not. The following SAS/IML statements compute the mean and median of these data:
proc iml;
x = {6.25, 6.27, 6.28, 6.34,  63.1};
mean = mean(x); /* or x[:] */
median = median(x);
print mean median; |
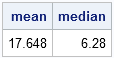
The mean is not representative of the bulk of the data, but the median is.
Although the survey article doesn't mention it, there are two other robust estimators of location that have been extensively studied. They are the trimmed mean and the Winsorized mean:
trim = mean(x, "trimmed", 0.2); /* 20% of obs */ winsor = mean(x, "winsorized", 1); /* one obs */ print trim winsor; |
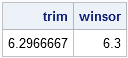
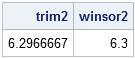
The trimmed mean is computed by excluding the k smallest and k largest values, and computing the mean of the remaining values. The Winsorized mean is computed by replacing the k smallest values with the (k+1)st smallest, and replacing the k largest values with the (k+1)st largest. The mean of these remaining values is the Winsorized mean. For both of these functions, you can specify either a number of observations to trim or Winsorize, or a percentage of values. Formulas for the trimmed and Winsorized means are included in the documentation of the UNIVARIATE procedure. If you prefer an example, here are the equivalent computations for the trimmed and Winsorized means:
trim2 = mean( x[2:4] ); winsor2 = mean( x[2] // x[2:4] // x[4] ); print trim2 winsor2; |
Robust Estimates in the UNIVARIATE Procedure
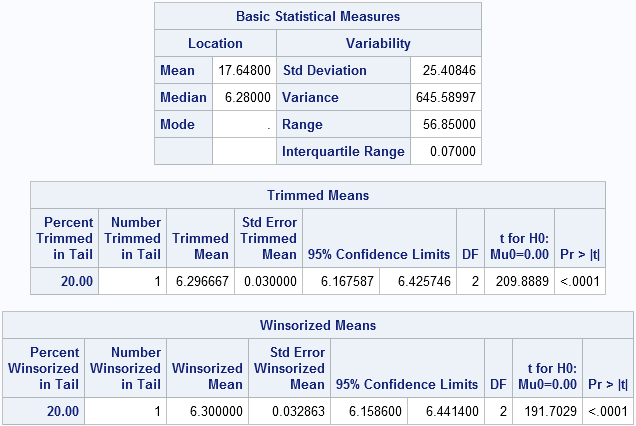
The UNIVARIATE procedure also supports these robust estimators. The trimmed and Winsorized means are computed by using the TRIM= and WINSOR= options, respectively. Not only does PROC UNIVARIATE compute robust estimates, but it computes standard errors as shown in the following example.
data a; input x @@; datalines; 6.25 6.27 6.28 6.34 63.1 ; proc univariate data=a trim=0.2 winsor=1; var x; ods select BasicMeasures TrimmedMeans WinsorizedMeans; run; |
Next time: Computing robust estimates of scale.

12 Comments
Hi Rick, if you could do a blog post explaining "Data Depth" and how to calculate in SAS ( dont have IML) that would be great. The seminal paper for this is "MULTIVARIATE ANALYSIS BY DATA DEPTH: DESCRIPTIVE STATISTICS, GRAPHICS AND INFERENCE by BY REGINA Y. LIU, JESSE M. PARELIUS AND KESAR SINGH , The Annals of Statistics 1999, Vol. 27, No. 3, 783-858"
Thanks for the paper reference. I haven’t read it, but it sounds interesting. Readers: Does anyone know of code to do this in SAS? If so, post a link.
Nice post. I think the trimmed and Winsorized mean are very under-utilized.
Do you know of any literature indicating which of these is preferable, and under what conditions?
For the trimmed and Winsorized means, you have to know in advance how many observations to trim. It becomes circular: to find a robust center, trim the outliers; to trim the outliers, you have to know how many they are; to know how many there are, you need to find a robust center....
From a theoretical point of view, the trimmed/Winsorized means have some nice properties like formulas for standard errors/confidence intervals. However, they are not as robust as the median (which has a high "breakdown value") and, as I said, you have to "tune" them to the data, whereas the median works for all data, regardless of whether you have 5%, 10%, or 20% outliers.
I would consider trimming/Winsorizing if I think that my data are from a contaminated normal distribution. That is, the "real" data are normally distributed, and the outliers are from a symmetric distribution with the same mean. If the data or outliers are skewed (for example, always larger than the population mean), I would not trim/Winsorize.
I would do I know in advance the number of observations to trim or winsorized. I have huge data set about 13000 observation with outliers. If I am to winsorize, how many observations do I use?
Thanks
That's a good question. It depends on the distribution of the variable and how noisy the data are. Many researchers use 5% or 10% of the sample size.
Pingback: Detecting outliers in SAS: Part 2: Estimating scale - The DO Loop
Pingback: Detecting outliers in SAS: Part 3: Multivariate location and scatter - The DO Loop
Pingback: Functions to know: The MEAN, VAR, and STD functions - The DO Loop
Once I've calculated the new trimmed values, how do I create a new dataset that drops the outliers?
You can get the trimmed data set by sorting the data and then excluding the first and last observations. You can do this in Base SAS or in SAS/IML. For example, if you have 100 observations and want to trim the smallest and largest 10 observations, sort the data and then use the FIRSTOBS= and OBS= data set options to extract the data:
data want; set SortedData(firstobs=11 obs=90); run;
The SAS/IML code would be
want = sorted[11:90,];
Pingback: The expected value of the tail of a distribution - The DO Loop