All Posts

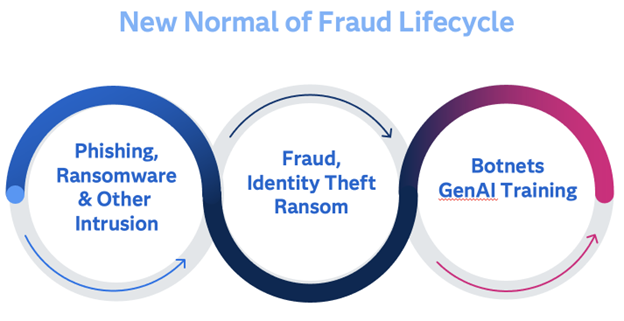
When we think of something “new”, we tend to picture something clean, shiny, or efficient. The new normal of fraud only checks one of those boxes, and unfortunately, that’s “efficient.” Today, scams and cyber attacks are persistent, and part of a larger ecosystem of phishing and hacking attacks by both

Generative AI (GenAI) is booming. It’s not just a trend; it’s produced a seismic shift in how we approach innovation and technology. SAS Innovate 2024 has moved on from Las Vegas and is now on tour across the world. If you want a recap of what happened in Vegas or

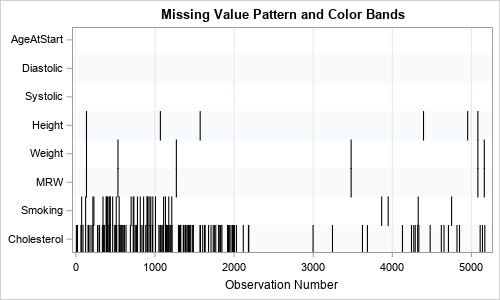
Years ago, I wrote an article that showed how to visualize patterns of missing data. During a recent data visualization talk, I discussed the program, which used a small number of SAS IML statements. An audience member asked whether it is possible to construct the same visualization by using only

An uncertain global economic climate has created a sense of unease and a heightened risk when managing finances for individuals and banking and financial institutions. Helping banks and financial institutions manage risk is a central pillar of how SAS adds value for our customers, who must ensure their organization is

Well, there's another plot twist in the Google third-party cookie deprecation saga. After years of banter and shifting deadlines, Google has decided to abandon its plans to phase out third-party cookies from Chrome. What does this mean for marketers? Even though third-party cookies aren't being removed, Google is planning to

May is the beginning of swim season as beaches, pools, water parks and splash pads begin to open, and people spend more time outdoors. May is also National Water Safety Month. This annual campaign is supported by the Pool & Hot Alliance, the American Red Cross (ARC), the National Drowning

SAS' Federica Citterio answers the perennial data science question: "How can I trust (generative) LLM to provide a reliable, non-hallucinated result?"

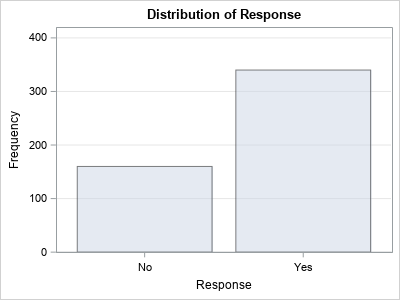
A SAS programmer wanted to estimate a proportion and a confidence interval (CI), but didn't know which SAS procedure to call. He knows a formula for the CI from an elementary statistics textbook. If x is the observed count of events in a random sample of size n, then the

O bacharel em sistemas de informação Robson Souza mal completou um ano no SAS, como Customer Success Manager, e já tem muita história para contar. Ele é responsável por acompanhar toda a jornada de clientes do Brasil, com foco na área de telecomunicação, garantindo que estas empresas tenham sucesso em

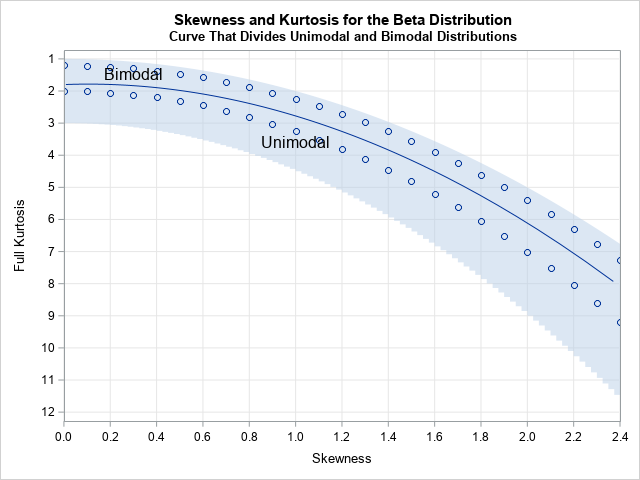
In a recent article, I graphed the PDF of a few Beta distributions that had a variety of skewness and kurtosis values. I thought that I had chosen the parameter values to represent a wide variety of Beta shapes. However, I was surprised to see that the distributions were all

Deploying AI insights isn't just about pushing buttons and hoping for the best. The deployment phase is a pivotal moment where technology and ethics meet. When transitioning AI models from development to real-world use, prioritizing trustworthiness remains important. It’s not just about algorithms; it’s about how AI impacts people and

春になった。桜の開花時期が気になるが、今年の開花(※)は平年より少し遅かったそう。気温が上がると通常よりも早く咲くことがあるそうだが今年はそうはいかなかった。 桜の開花は主に気温が関わっており、簡単に予想できる方法がある。400度の法則といい、2月1日以降の日々の平均気温を合計して400度を超えると開花する、という代物。600度の法則というものもある。こちらは、平均気温ではなく、最高気温を合計したものだ。 いずれの法則も桜の花芽は秋から冬にかけて「休眠」状態に入り、真冬の寒さで目覚める「休眠打破」を2月1日とし、1日以降の気温の積み上げたものである。この法則が今年は当たらず、公式な開花日は予想より1週間くらい遅れての3月29日だったがとくに700度を超えた時であった。暖冬の影響で休眠スイッチがうまく作動しなかったからという説がある。異常気温の影響もあるだろうし、まさに異常値だった。 実は、上記のシンプルな指標以外に、桜の開花予測には回帰分析というデータ分析の手法が利用されている。気温、降水量、日照量などの気象データで統計モデルを構築して開花日を予測する。この手法は、例えば、一般的にはマーケティングの販売促進やロイヤルティ向上、金融業界では信用取引のスコアリングや不正検出に、医薬業界では疾病リスクや治療効果予測などに広く利用されている。具体的な紹介は、ぜひとも別の機会にしたい。 機械学習やAIばかり注目を浴びている中、その基盤となるものは回帰分析のようなデータ分析の手法であることに忘れてはいけない。5~6月には回帰分析をテーマにしたトレーニングコースが多く開催されるが(SAS Training | スケジュール)、春になったし新たなチャレンジの始まりと、ぜひ受講して新しいスキルを身につけて頂きたいところ。 ところで桜は、実に種類が多く、日本だけでも600種以上が分布しており、色もよく見かける白やピンク色だけでなく緑色もあるそう。とりわけ、日本でよく見かける桜を時間軸でいうと、河津桜、染井吉野、枝垂れ桜、八重桜、冬桜といったところ。うちの近所でピンク色で輝いていたカワズザクラはとくに散ってしまい、染井吉野と八重桜が満開の日を迎えている。 ※桜の開花日とは、標本木で5~6輪以上の花が開いた最初の日をいい、観測対象は主に染井吉野を対象としている(気象庁 | 生物季節観測の情報)。 2024年4月初 相吉

Charcuterie (pronounced shaar-koo-tuh-ree) boards are a great way to bring people together and spark conversation. Whether served as a causal snack, an upscale appetizer or part of a lavish feast, the charcuterie board is a beloved culinary tradition. With a little planning, you can create a healthy and delicious charcuterie

Digital banking, big tech and data privacy are all contributing to a shift in the Scandinavian banking scene, according to Tom Palving, Center of Excellence Lead for Digital Communication and Sales Loyalty at Jyske Bank. As a result, says Palving, traditional banks are facing a number of challenges, including: Customers

Urbanization is rapidly accelerating, allowing communities to grow with more access to services and technological advancements. However, this quick change in growth can present challenges as well, such as pollution and lack of infrastructure. Smart cities can support urbanization by offering innovative solutions with artificial intelligence (AI), the Internet of


