All Posts
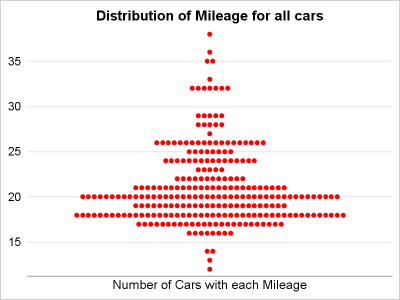

Last year, a user asked about creating a "Turnip Plot" as used in this study of Caesarian Section Rates. Primarily, this is similar to a histogram on the y-axis for each unique value on the y-axis. A marker is drawn for each occurrence, starting from the center. Back then, I
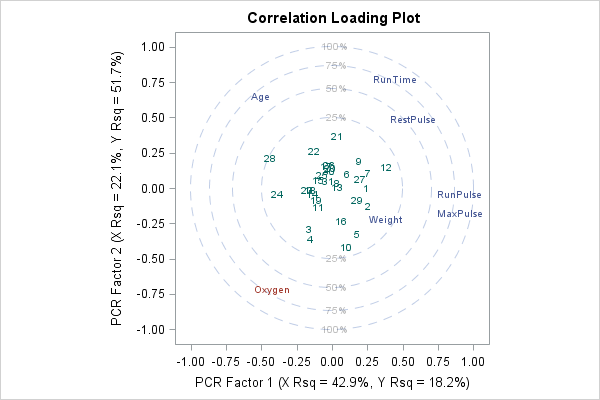

A common question on discussion forums is how to compute a principal component regression in SAS. One reason people give for wanting to run a principal component regression is that the explanatory variables in the model are highly correlated which each other, a condition known as multicollinearity. Although principal component
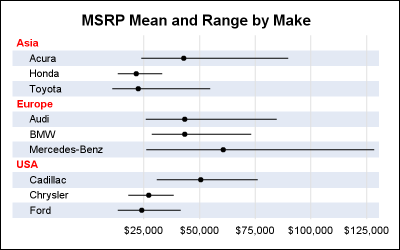
The previous post on Multiple Blank Categories showed how to include multiple blank categories on the axis. But, given the purpose for this was to separate different segments in the data, I also included ideas on how to segmented a discrete axis using reference lines or Block Plot. A similar idea

To make accurate predictions, it is necessary that the sample data you use for model development is compatible with the target population. The distribution of each input used in the model should be similar in the sample and the target population. In your model you should include only those variables


There are many compelling reasons existing SAS users might want to start integrating SAS Viya into their SAS9 programs and applications. For me, it comes down to ease-of-use, speed, and faster time-to-value. With the ability to traverse the (necessarily iterative) analytics lifecycle faster than before, we are now able to generate
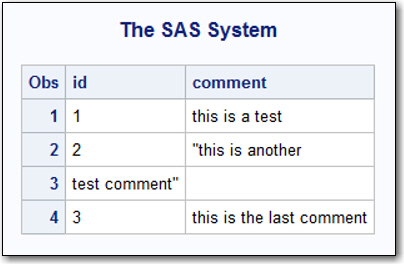

Reading an external file that contains delimiters (commas, tabs, or other characters such as a pipe character or an exclamation point) is easy when you use the IMPORT procedure. It's easy in that variable names are on row 1, the data starts on row 2, and the first 20 rows


“The difference between style and fashion is quality.” -Giorgio Armani With an out-of-the-box SAS Enterprise Guide (EG) installation, when you build a report in SAS EG it is displayed in a nice-looking default style. If you like it, you can keep it, and continue reading. If you don’t quite


I hope everyone has noticed some new shortcuts in Graphically Speaking. As you scroll down and look to the right, there are shortcuts for Sanjay's getting started and clinical graphs posts and one for my advanced blogs. When Sanjay asked me to make an icon for my advanced blogs, at


Todo lo digital es rastreable, medible, identificable y por ende, potenciable. El hecho de que los usuarios dejen huella en cada una de sus interacciones y que las empresas puedan tener en cuenta todos esos micromomentos para tomar mejores decisiones, es lo que ha llevado a que la transformación digital
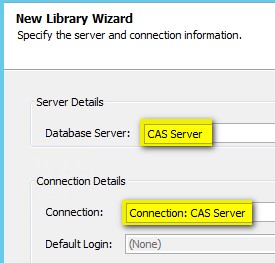

The goal of this article is to describe the steps needed to configure the bridge that allows SAS Data Integration 4.902, based on SAS 9.4M4, to load data directly into CAS on SAS Viya 3.2. Of course, SAS 9.4M5 simplifies this process, as a SAS/CONNECT communication will no longer be required, enabled


My father introduced me to Gene Kelly and Donald O’Connor when I was 10… in a figurative sense. Dad loved musicals and Singin’ In The Rain became one of my favorites. I was obsessed with their tap dance to Moses Supposes and practiced every day after school until I ‘got


매년 가을이면 미국 전역의 고속도로, 주택가, 뒷길은 노란색으로 물듭니다. 여름 방학이 끝난 후, 질서 정연하고 조심스럽게 학생들을 학교로 데려가는 통학 버스 때문인데요. 보스턴 공립 학교(BPS; Boston Public Schools)는 지난 학기 동안 매일 버스 650대로 총 4만5,000마일을 달려 2만5,000명의 학생들을 통학시켰습니다. 해당 지역은 전국에서 가장 오래된 공립 학교 구역으로, 이 버스들은


To get full value from analytics programs, Todd Wright says be sure you can first access, integrate, cleanse and govern your data.
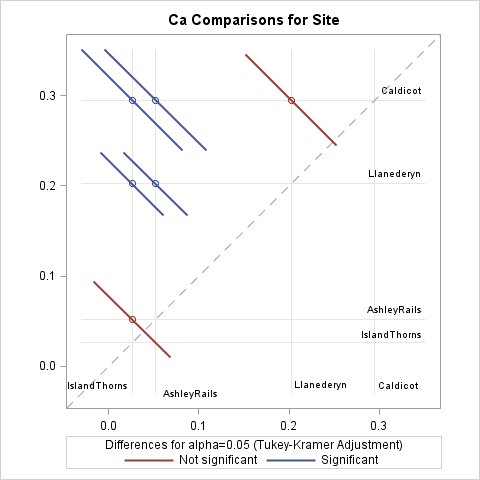
In a previous article, I discussed the lines plot for multiple comparisons of means. Another graph that is frequently used for multiple comparisons is the diffogram, which indicates whether the pairwise differences between means of groups are statistically significant. This article discusses how to interpret a diffogram. Two related plots
In a previous article, I discussed the lines plot for multiple comparisons of means. Another graph that is frequently used for multiple comparisons is the diffogram, which indicates whether the pairwise differences between means of groups are statistically significant. This article discusses how to interpret a diffogram. Two related plots