All Posts


“The difference between style and fashion is quality.” -Giorgio Armani With an out-of-the-box SAS Enterprise Guide (EG) installation, when you build a report in SAS EG it is displayed in a nice-looking default style. If you like it, you can keep it, and continue reading. If you don’t quite


I hope everyone has noticed some new shortcuts in Graphically Speaking. As you scroll down and look to the right, there are shortcuts for Sanjay's getting started and clinical graphs posts and one for my advanced blogs. When Sanjay asked me to make an icon for my advanced blogs, at


Todo lo digital es rastreable, medible, identificable y por ende, potenciable. El hecho de que los usuarios dejen huella en cada una de sus interacciones y que las empresas puedan tener en cuenta todos esos micromomentos para tomar mejores decisiones, es lo que ha llevado a que la transformación digital
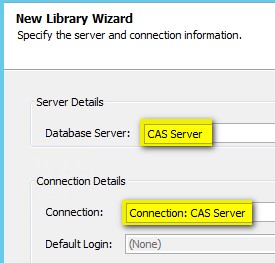

The goal of this article is to describe the steps needed to configure the bridge that allows SAS Data Integration 4.902, based on SAS 9.4M4, to load data directly into CAS on SAS Viya 3.2. Of course, SAS 9.4M5 simplifies this process, as a SAS/CONNECT communication will no longer be required, enabled


My father introduced me to Gene Kelly and Donald O’Connor when I was 10… in a figurative sense. Dad loved musicals and Singin’ In The Rain became one of my favorites. I was obsessed with their tap dance to Moses Supposes and practiced every day after school until I ‘got


매년 가을이면 미국 전역의 고속도로, 주택가, 뒷길은 노란색으로 물듭니다. 여름 방학이 끝난 후, 질서 정연하고 조심스럽게 학생들을 학교로 데려가는 통학 버스 때문인데요. 보스턴 공립 학교(BPS; Boston Public Schools)는 지난 학기 동안 매일 버스 650대로 총 4만5,000마일을 달려 2만5,000명의 학생들을 통학시켰습니다. 해당 지역은 전국에서 가장 오래된 공립 학교 구역으로, 이 버스들은


To get full value from analytics programs, Todd Wright says be sure you can first access, integrate, cleanse and govern your data.
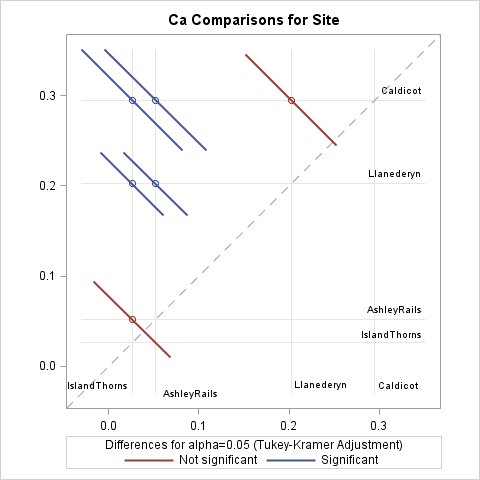

In a previous article, I discussed the lines plot for multiple comparisons of means. Another graph that is frequently used for multiple comparisons is the diffogram, which indicates whether the pairwise differences between means of groups are statistically significant. This article discusses how to interpret a diffogram. Two related plots
In a previous article, I discussed the lines plot for multiple comparisons of means. Another graph that is frequently used for multiple comparisons is the diffogram, which indicates whether the pairwise differences between means of groups are statistically significant. This article discusses how to interpret a diffogram. Two related plots


Este 19 de octubre se celebra el día internacional contra el cáncer de mamá y hoy la analítica está contribuyendo a salvar la vida de muchas mujeres que padecen esta terrible enfermedad, un ejemplo de superación. Susan Weidner, vicepresidente sénior de IntrinsiQ Specialty Solutions. Susan fue diagnosticada con cáncer de


La aplicación de la inteligencia artificial en los negocios constituye un área en constante evolución cuya demanda aumenta día con día. Este fenómeno es resultado de la alta interacción máquina-humano que experimentamos en varios aspectos de nuestras vidas, así como de la necesidad constante de aprender y actuar de forma
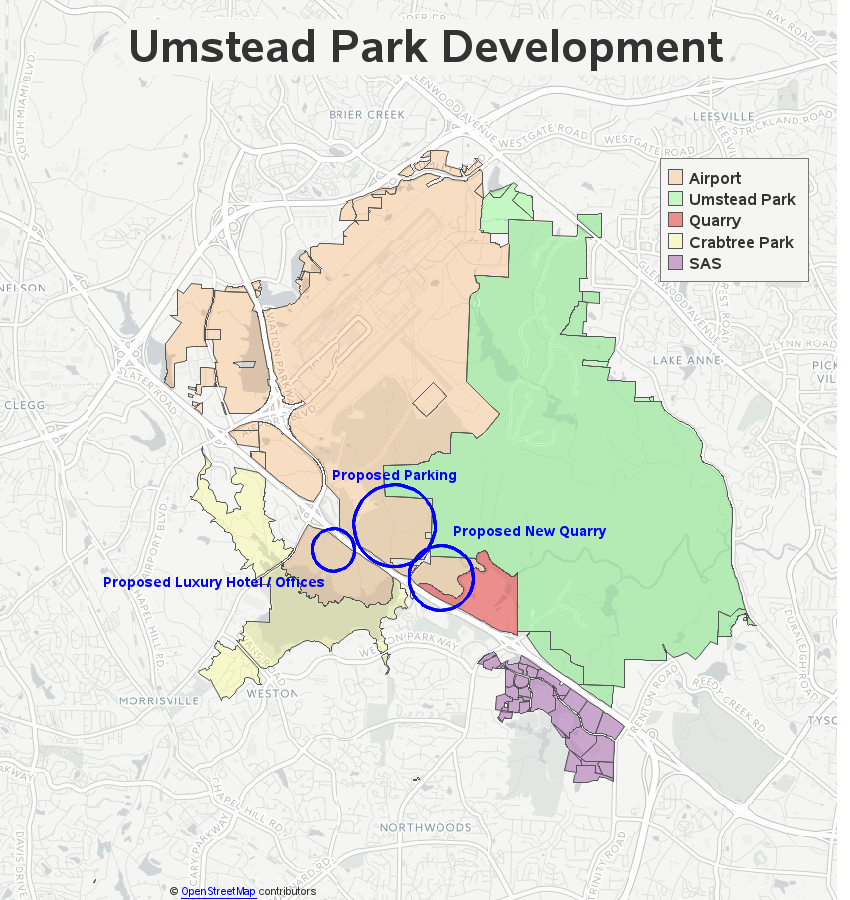

In growing areas such as the Research Triangle Park, there is always the tough decision between developing land for business, or keeping it natural for parks and recreation. SAS is fortunate to have the great hiking trails at Umstead Park just across the road to the north - it's the


In the field of machine learning, online learning refers to the collection of machine learning methods that learn from a sequence of data provided over time. In online learning, models update continuously as each data point arrives. You often hear online learning described as analyzing “data in motion,” because it


You know the value of your SAS Certification; does the rest of the world? A recent MONEY and Payscale.com study named SAS Analytics skills as the most valuable skills to have in today’s job market and certification is the best way to demonstrate those skills. Recognition like this helps solidify


If you checked the Work/Life calendar of events this summer, you may have seen ads to meet with me to discuss character strengths and how to incorporate them into your everyday. It’s been a pretty popular offering, and that’s really no surprise. Who doesn’t want to learn more about themselves