All Posts


‘사물인터넷(IoT)’ 세상을 바꾸다 데이터 포 굿(Data for Good)! 사물인터넷(IoT)의 폭발적인 성장과 함께 점점 더 많은 분야에서 데이터가 선하고 유용하게 사용되고 있습니다. 하루가 다르게 데이터를 수집하고 인사이트를 생성하기 위한 독창적이고 참신한 방식이 소개되고 있는데요. 환자가 치료 계획을 잘 지킬 수 있도록 돕는 스마트 알약: 사람이 삼킬 수 있는 센서는 약의 복용뿐만 아니라


If you’ve been waiting for the buzz to settle around the Internet of Things before deciding how to invest in this new technology space, now’s the time to stop waiting. I’ve been working in the technology sector for a few decades, and the innovation and excitement I’m seeing around IoT


When loading data into CAS using PROC CASUTIL, you have two choices on how the table can be loaded: session-scope or global-scope. This is controlled by the PROMOTE option in the PROC CASUTIL statement. Session-scope loaded proc casutil; load casdata="model_table.sas7bdat" incaslib="ryloll" outcaslib="otcaslib" casout="model_table”; run; Global-scope loaded proc casutil; load casdata="model_table.sas7bdat"
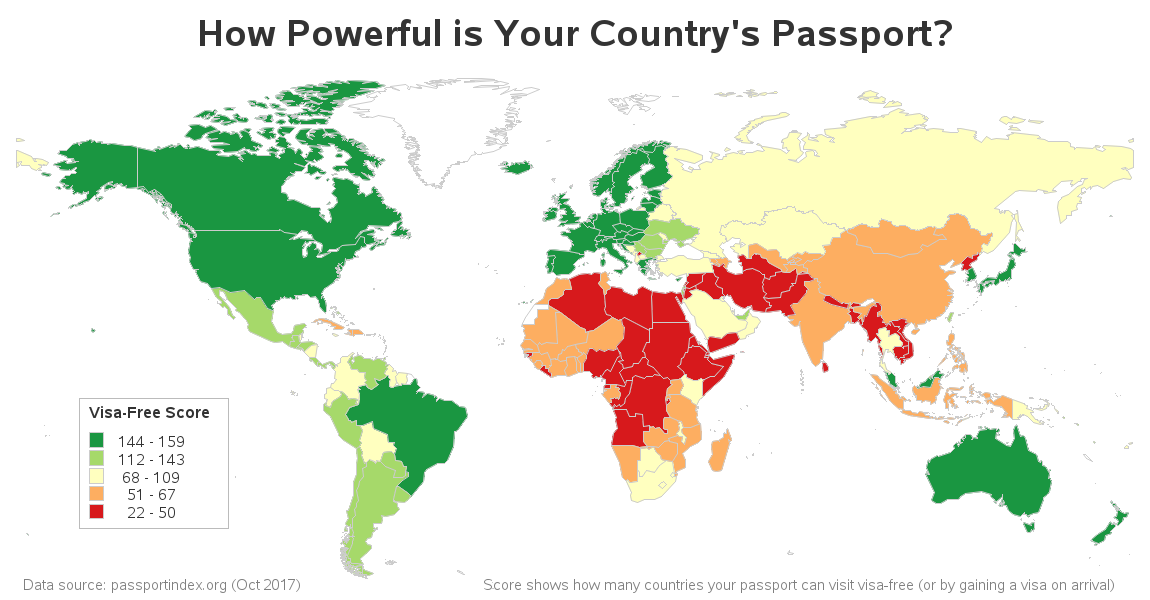

If you plan to travel abroad and see the world, you'll need a passport. And, depending on several factors, you might also need travel visas. Which passports allow you to travel with the least amount of hassle (and the least amounts of visas)? Let's create a map to help you


‘호모 나랜스(Homo Narrans)’라는 단어를 들어보셨나요? ‘이야기하는 사람’을 뜻하는 라틴어로 1999년 미국의 영문학자 존 닐(John Niels)이 동일 제목의 저서를 통해 처음 소개했습니다. 그는 인간은 태생적으로 이야기하려는 본능을 가지며, 이야기를 주고받지 않고서는 살아갈 수 없고, 이야기를 통해 사회를 이해한다고 설명했는데요. 이야기는 기억에 남으며, 사람과 감정적으로 연결되고, 행동을 고취시킵니다. ‘이야기하다’라는 뜻의 ‘스토리텔링(Storytelling)’은 지속적이며


David Loshin describes some steps you can take to ensure that self-service data preparation improves collaboration.


Todos conocemos el caso de alguien que amamos o que es parte de nuestra vida y que tiene una enfermedad o un tipo de cáncer. En el mundo cada día se registran nuevos casos de esta enfermedad, entre los principales se encuentran: pulmón, estómago, hígado, colon y mamá. De los
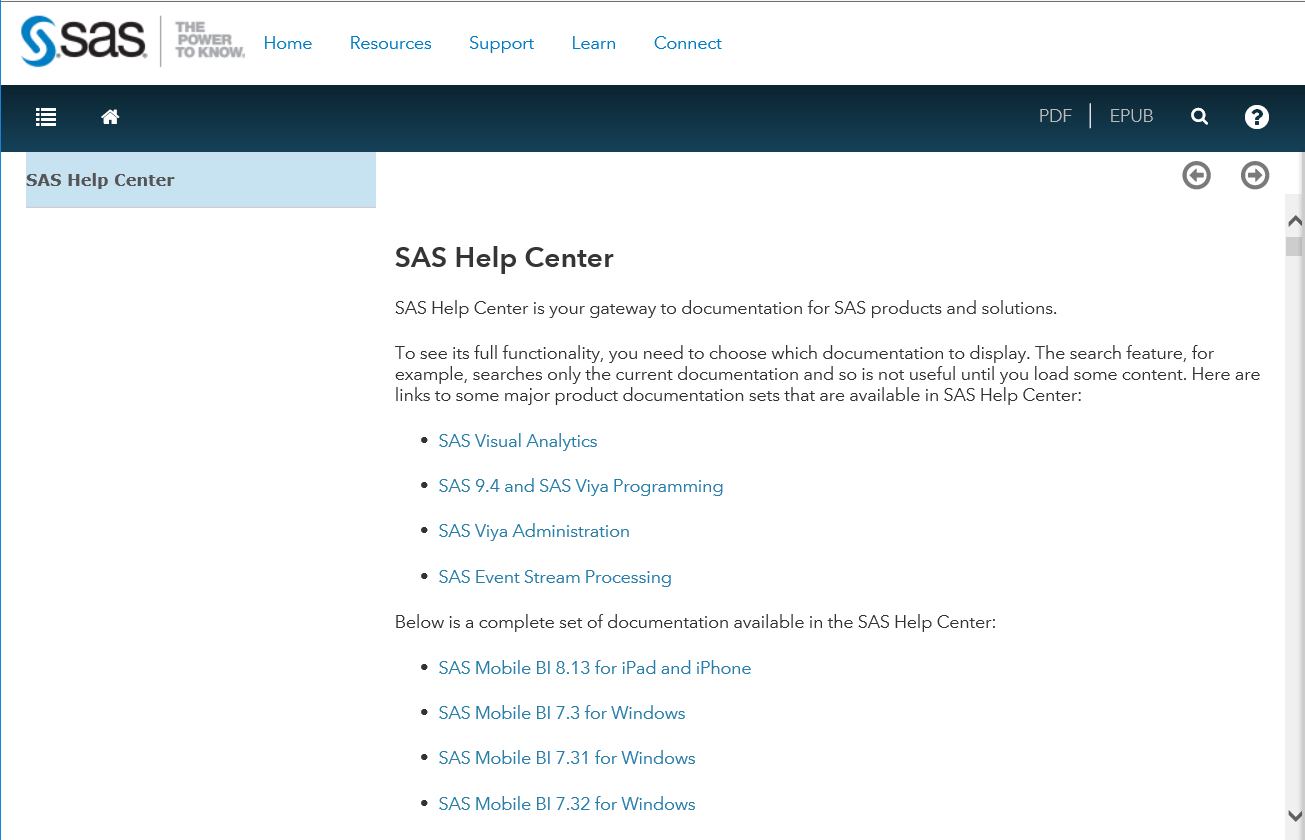

To improve is to change; to be perfect is to change often.-Winston Churchill If you've visited SAS documentation (also known as the "SAS Help Center") lately, you may have noticed that we've made some fairly significant changes in the documentation for SAS products and solutions. The new site is organized in a new way, search


Suppose you want a list of car manufacturers from the CARS dataset. Easy! Call the %CHARLIST macro from a %PUT statement, like this: The CHARLIST macro generates a list of unique values of a selected variable from a selected dataset. So does PROC FREQ. But, if you don't need statistics, the CHARLIST

현존 최고의 데이터 과학자들이 뽑은 머신러닝 알고리즘 개발 베스트 프랙티스! 그 대망의 마지막 시간입니다. 이전 블로그를 통해 다양한 유형의 모델을 결합하는 방법을 소개해드렸다면, 오늘은 다양한 유형의 데이터를 결합하고, 모델의 다양한 변수를 활용하는 방법에 대해 이야기하고자 합니다. 이전 시리즈를 놓치셨나요? 블로그 1탄, 블로그 2탄을 참고해주세요. 기본기 다지기 희귀한 이벤트 탐지하기 수많은 모델 결합하기 모델
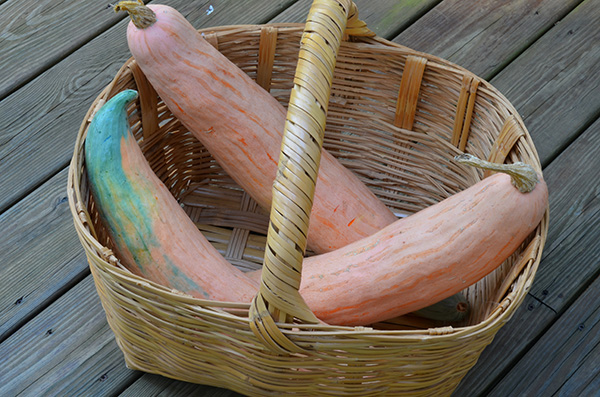
The North Georgia Candy Roaster I’m a North Carolina native, born and raised. So, it was quite a surprise at a recent trip to the farmers market when I came across this odd looking, large pink banana-shaped pumpkin-squash that I had never laid eyes on. When I asked what it
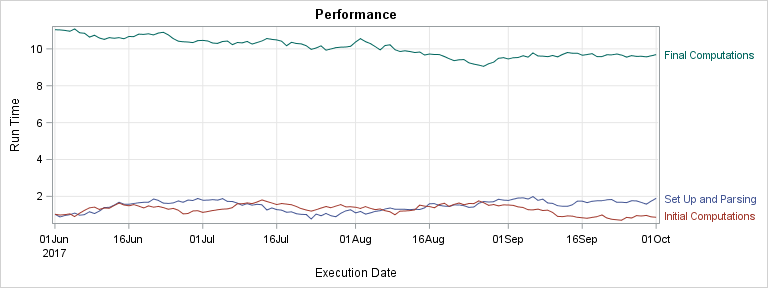

Curve labels in series plots can be positioned inside or outside the graph. Date variables can be specified as TYPE=LINEAR with a date format or more commonly as TYPE=DATE. Sometimes external curve labels might appear below or above the graph, particularly with TYPE=DATE axes. This post shows you ways to move them to the right of the graph.
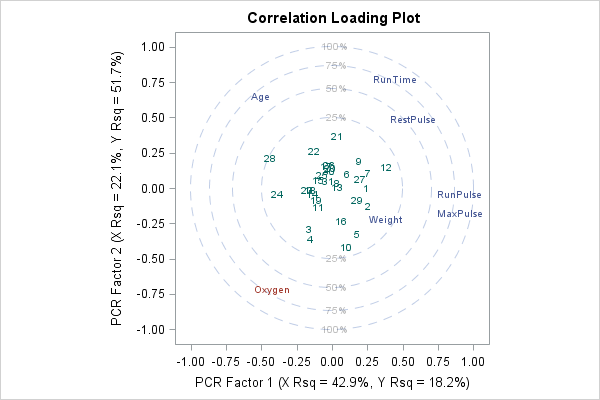

This article describes the advantages and disadvantages of principal component regression (PCR). This article also presents alternative techniques to PCR. In a previous article, I showed how to compute a principal component regression in SAS. Recall that principal component regression is a technique for handling near collinearities among the regression


Es claro que este año que está por finalizar ha traído grandes cambios para todo el mundo en cuanto a transformación digital se trata, se estructuraron cambios en las industrias, la economía e incluso las formas de comunicación con sus clientes. Pero la tecnología no se detiene y cada día
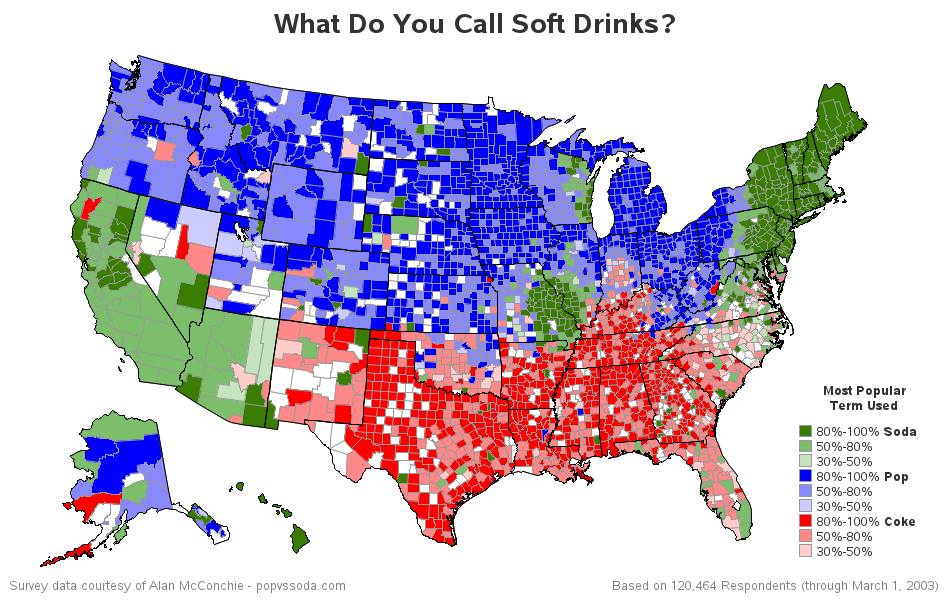
Quick Quiz! Where might you hear the following conversation? ... Waitress: "What would you like to drink, honey?" Customer: "I'll have a coke." Waitress: "What kind?" Customer: "Diet Pepsi." If you answered somewhere between Texas and Georgia, you would be correct! To those of us not from that area, it