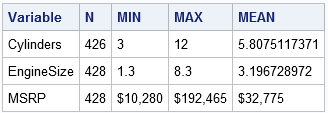
A SAS programmer wanted to display a table in which the rows have different formats. An example is shown below. The programmer wanted columns that represent statistics and rows that represent variables. She wanted to display formats (such as DOLLAR) for some variables—but only for certain statistics. For example, the number of nonmissing observations (N) should never use the format of the variable, whereas the minimum, maximum, and mean values should.
In SAS you can easily apply a format to a column, but not to a row. However, SAS provides two techniques that enable you to control the appearance of cells in tables:
- You can use PROC TEMPLATE to define a custom template. You can use the TRANSLATE function to control the appearance of a cell based on values of rows.
- You can use PROC REPORT and CALL DEFINE to apply a format to one or more cells.
Both PROC TEMPLATE and PROC REPORT have a learning curve. If you are in a hurry, an alternative solution is to use the DATA step to create a factoid. Recall that a factoid is an ODS table that contains character values and (formatted) numbers in the same column. A factoid can display mixed-type data by converting every value to a string. This conversion process gives you complete control over the format of each cell in the table. Consequently, you can use context to format some numbers differently from other numbers.
Creating a custom factoid
Suppose that you want to generate the table shown at the top of this article. You can obtain the statistics from PROC MEANS and then transpose the data. The following statements produce an output data set that contains descriptive statistics for three variables in the Sashelp.Cars data:
proc means data=sashelp.cars noprint; var Cylinders EngineSize MSRP; output out=stats(drop=_TYPE_ _FREQ_ rename=(_STAT_=Label1) where=(Label1 ^= "STD") ); run; proc print data=stats noobs; run; |
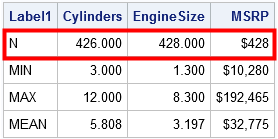
I have highlighted the first row of the output data to indicate why this output is not suitable for a report. The output variables retain the format of the original variables. However, the 'N' statistic is the sample size, and a sample of size '$428' does not make sense! Even '428.000' is a strange value to see for a sample size. It would be great to format the first row with an intrger format such as 8.0.
The next DATA step creates three character variables (CVALUE1-CVALUE3) that contain formatted values of the three numerical variables in the data. The SELECT-WHEN statement does the following:
- For each observation and for each of the three numerical variables:
- If the LABEL1 variable is 'N', then apply the 8.0 format to the value of the numerical variable.
- Otherwise use the VVALUE function to get the formatted value for the numerical variable.
data Factoid; set stats; array nValue[3] Cylinders EngineSize MSRP; /* numerical variables */ array cValue[3] $12.; /* cValue[i] is formatted version of nValue[i] */ /* with a little effort you could assign labels dynamically */ label cValue1="Cylinders" cValue2="EngineSize" cValue3="MSRP"; do i = 1 to dim(nValue); select (Label1); when ('N') cValue[i] = put(nvalue[i], 8.0); otherwise cValue[i] = vvalue(nvalue[i]); end; end; run; proc print data=Factoid label noobs; var Label1 cValue:; run; |
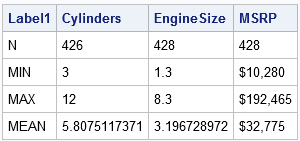
The output displays the character columns, which contain formatted numbers. With additional logic, you could display fewer decimal values for the MEAN row.
Transpose the factoid
The previous table contains the information that the programmer wants. However, the programmer asked to display the transpose of the previous table. For completeness, here are SAS statements that transpose the table:
proc transpose data=Factoid out=TFactoid; var cValue:; ID Label1; IDLABEL Label1; run; proc print data=TFactoid(drop=_NAME_) noobs label; label _LABEL_ = "Variable"; run; |
The final table is displayed at the top of the article.
Summary
In summary, this article shows one way to display a column of data in which each cell potentially has a different format. The trick is to create a factoid, which means that you create a character copy of numeric data. As you create the copy, you can use the PUT function to apply a custom format, or you can use the VVALUE function to get the existing formatted value.
In general, you should try to avoid creating copies of data, so use PROC TEMPLATE and PROC REPORT if you know how. However, if you don't know how to use those tools, the factoid provides an alternative way to control the formatted values that appear in a table. Although not shown in this article, a factoid also enables you to display character and numeric values in the same column.
