All Posts


No se sorprenda si su empresa de telecomunicaciones es la que decide el próximo teléfono que usted debe comprar o la aerolínea, el siguiente destino de sus vacaciones: las ofertas que más le convienen, el producto ideal o el servicio que debería contratar es información que ya está en sus


Correlation is a fundamental statistical concept that measures the linear association between two variables. There are multiple ways to think about correlation: geometrically, algebraically, with matrices, with vectors, with regression, and more. To paraphrase the great songwriter Paul Simon, there must be 50 ways to view your correlation! But don't

From June 6 to 9 the first ever ‘Dutch Data Science Week’ took place in the Netherlands. The week consisted of 4 days in which 28 events took place in 6 different locations. During the week people could attend classes ranging from beginner to advanced levels, visit meetups, participate in


SAS Viyaで線形回帰を行う方法を紹介します。 言語はPythonを使います。 SAS Viyaで線形回帰を行う方法には大きく以下の手法が用意されています。 多項回帰: simpleアクションセットで提供。 一般化線形回帰または一般線形回帰: regressionアクションセットで提供。 機械学習で回帰: 各種機械学習用のアクションセットで提供。 今回は単純なサインカーブを利用して、上記3種類の回帰モデルを作ってみます。 【サインカーブ】 -4≦x<4の範囲でサインカーブを作ります。 普通に $$y = sin(x) $$を算出しても面白みがないので、乱数を加減して以下のようなデータを作りました。これをトレーニングデータとします。 青い点線が $$y=sin(x)$$ の曲線、グレーの円は $$y=sin(x)$$ に乱数を加減したプロットです。 グレーのプロットの中心を青い点線が通っていることがわかります。 今回はグレーのプロットをトレーニングデータとして線形回帰を行います。グレーのプロットはだいぶ散らばって見えますが、回帰モデルとしては青い点線のように中心を通った曲線が描けるはずです。 トレーニングデータのデータセット名は "sinx" とします。説明変数は "x"、ターゲット変数は "y" になります。 各手法で生成したモデルで回帰を行うため、-4≦x<4 の範囲で0.01刻みで"x" の値をとった "rangex" というデータセットも用意します。 まずはCASセッションを生成し、それぞれのデータをCASにアップロードします。 import swat host = "localhost" port = 5570 user = "cas" password = "p@ssw0rd"
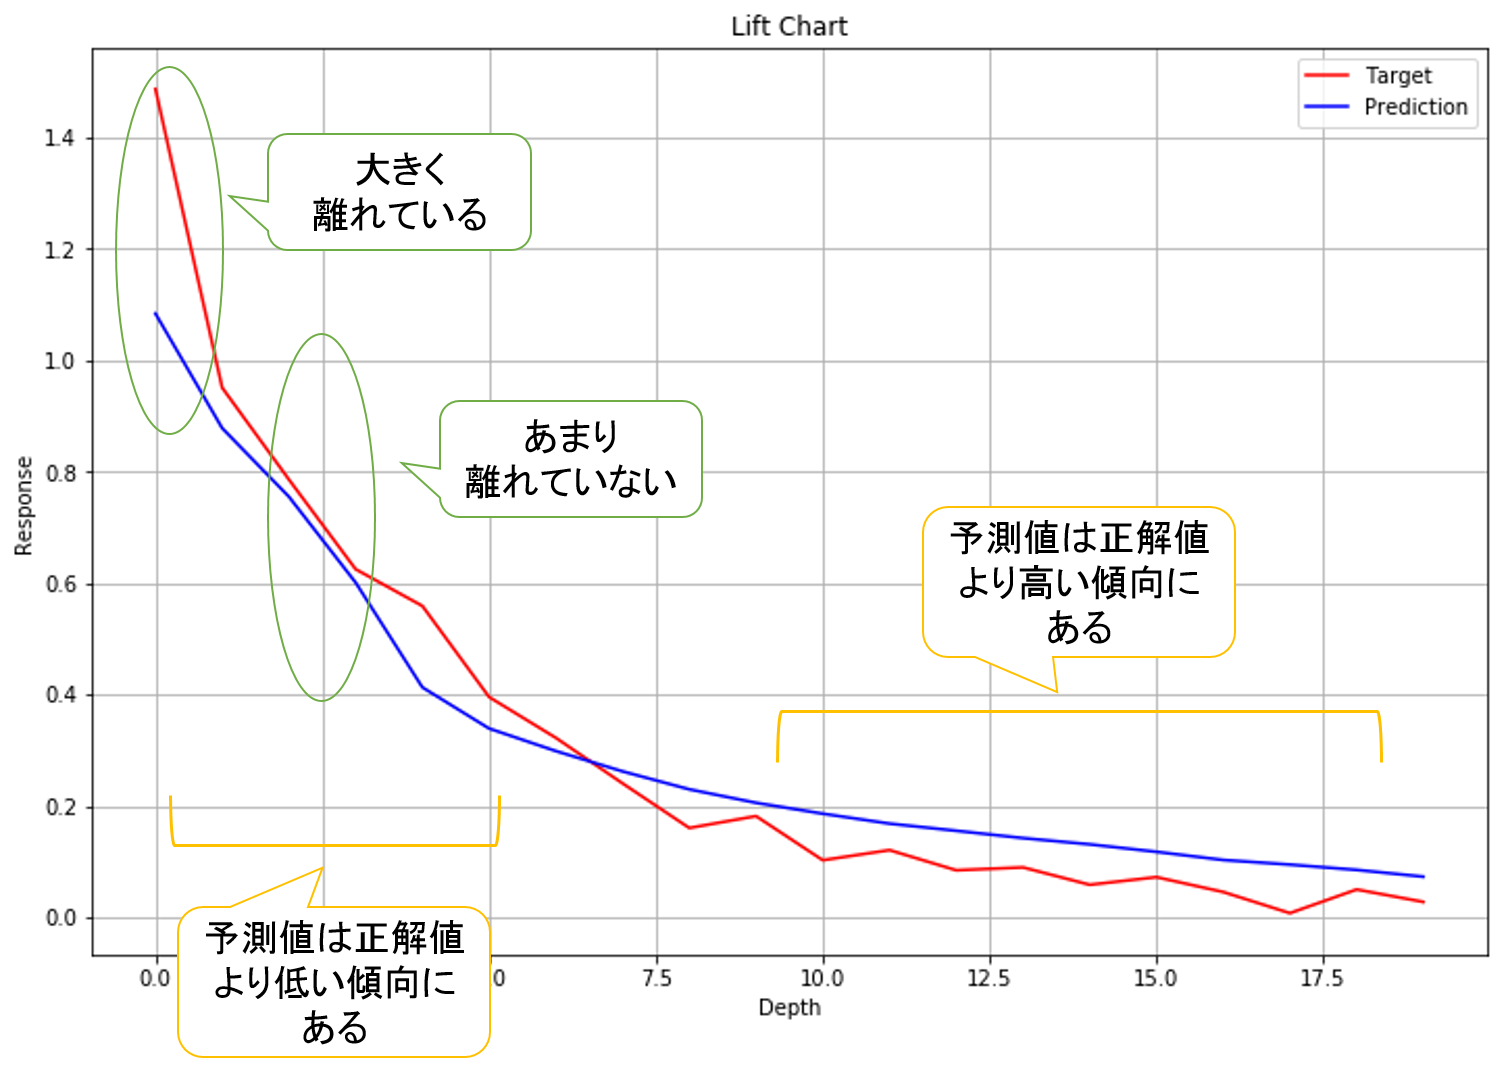

先日投稿した「機械学習のパラメータをオートチューニングしよう(分類編)!」の続きです。 今回は回帰分析をオートチューニングします。 あらまし 機械学習の課題はパラメータチューニングで、手動で最高のパラメータを探そうとすると、とても時間がかかり効率的ではありません。 SAS Viyaではパラメータチューニングを自動化するオートチューニング機能を提供しています。 オートチューニング機能を使うことで、限られた時間内、条件下で最高のパラメータを探索し、予測モデルを生成することができます。 今回やること 今回はオートチューニングを使って数値予測モデルを生成します。 使うデータは架空の銀行の金融商品販売データです。顧客の取引履歴と営業履歴から構成されており、新たな金融商品の販売数を予測するデータとなっています。 内容は以下のようになっており、約5万行、22列の構成です。 1行1お客様データとなっていて、顧客の口座情報や取引履歴、営業履歴が1行に収納されています。 ターゲット変数はcount_tgtで、これは各顧客が購入した金融商品数を表しています。 ほとんどが0(=未購入)ですが、購入されている顧客の購入数を予測するモデルを生成します。 今回はランダムフォレストを使って予測したいと思います。 ランダムフォレストは別々の決定木を複数作り、各決定木の予測値をアンサンブルして最終的な予測値とする機械学習の一種です。 まずは手動で予測 SAS Viyaでランダムフォレストを使って予測モデルを生成するにあたり、まずはCASセッションを作ってトレーニングデータとテストデータをインメモリにロードします。 # PythonからCASを操作するためのSWATライブラリをインポート import swat # 接続先ホスト名、ポート番号、ユーザー名、パスワードを指定 host = "localhost" port = 5570 user = "cas" password = "p@ssw0rd" # mysessionという名称のCASセッションを作成 mysession = swat.CAS(host, port, user, password)


매일 전 세계 수백만 플레이어들이 가상의 전투에서 서로의 탱크를 무찌르기 위해 ‘월드 오브 탱크(World of Tanks)’에 접속합니다. 국내에서도 큰 인기를 끌고 있는 월드 오브 탱크는 벨라루스 게임 개발사인 워게이밍(Wargaming)의 온라인 MMO(대규모 다중 사용자) 슈팅 게임인데요. 등록된 온라인 사용자만 무려 1억1,000만명이 넘습니다. 워게이밍은 목표는 모든 레벨의 플레이어에게 멋진 경험을 제공하는 것으로, 부분 유료(free-to-play)

La identificación de nuevas fuentes de ingreso, el impacto en el desempeño del negocio y la mejora en la experiencia del cliente son algunas de las razones clave para que según el analista IDC, se estime un incremento del 12.4% con respecto a 2016 en lo que respecta a la

機械学習で予測モデルを作るとき、課題のひとつにパラメータのチューニングがあります。 パラメータとはどういう設定値や制限値で機械学習の予測モデルを作るのかを示すものです。 料理に例えると、チャーハンを作る過程が機械学習のアルゴリズムだとすると、どういう具材をどのくらいの量入れるのかがパラメータです。 お米の品種や卵の有無、豚肉か鶏肉か、調味料の種類や量がパラメータになります。チャーハンの良し悪しはこれらパラメータの良し悪しに左右されます。おいしいチャーハンを食べるためには、具材をベストな組み合わせと量で投入する必要があります。 昼食においしいチャーハンを食べたので、チャーハンでたとえました。 話を戻すと、機械学習の決定木の深さであったり、ニューラルネットワークのニューロン数であったり、パラメータは自分で設定する必要があります。機械学習では複数のパラメータを組み合わせて、ベストなレシピを作らねば良い予測モデルは作れません。 SAS Viyaでは各種機械学習アルゴリズムを提供していますが、各機械学習にそれぞれのパラメータが用意されています。料理に例えると、メニューにチャーハンのみならず餃子、ラーメン、寿司、ステーキ、チーズケーキがあるようなものです。シェフ(≒データサイエンティスト)は全てのベストなレシピ(≒パラメータ)を探索せねばならず、労力がいります。 しかし! SAS Viyaには更に便利な機能として、オートチューニングというものが用意されています。 オートチューニングは最も良いパラメータを短い時間で探索してくれる機能です。料理に例えると、究極のチャーハンレシピをViyaが自動的に作ってくれる機能です。夢のようですね。 オートチューニングでは機械学習のパラメータを変えながら複数の予測モデルを作り、最も良い予測モデルのパラメータを探してくれるというものです。決定木だけでもパラメータは10種類以上あるのですが、それらの最良な値をみつけてくれます。 パラメータチューニングを行う際、最も安易な探索方法は各パラメータの全パターンを試すことです。全パターンを試せば、その中から最も良いものはたしかにみつかります。しかし欠点はパラメータチューニングに長い時間がかかってしまい、現実的な手法ではありません。 SAS Viyaのオートチューニングはより賢いパラメータ探索のアルゴリズムを4種類用意しています。 遺伝的アルゴリズム(Genetic Algorithm, GA):パラメータを遺伝子と見立てて、淘汰、交叉、突然変異を組み換えすことでパラメータを探索する。 ラテン超方格サンプリング(Latin HyperCube Sampling, LHS):層別サンプリングの一種で、各パラメータをn個の区間に分割し、区間からランダムに値を取り出してパラメータを探索する。 ベイズ最適化(Bayesian Optimization):説明変数と予測の間にブラックボックス関数があると仮定し、ブラックボックス関数のパラメータの分布を探索する。 ランダムサンプリング(Random Sampling):ランダムにパラメータの値を選択して探索する。 探索アルゴリズムを詳しく説明していると終わらないので説明を短くまとめました。SAS Viyaではいずれかのアルゴリズムを利用してオートチューニングを実行することができます。 今回はPythonからSAS Viyaを操作して、オートチューニングを試してみたいと思います。 まずはPython SWATをimportし、CAS Sessionを生成してデータをロードします。 # PythonからCASを操作するためのSWATライブラリをインポート import swat # mysessionという名称のCASセッションを作成 mysession = swat.CAS(host, port, user, password) #


Everybody GET UP! Want to train the entire body in one exercise? This is it! The Turkish Getup is a multi-joint, multi-movement exercise that incorporates transitioning from the ground to standing. This exercise requires synergy, coordination, and core/shoulder stabilization to increase your functional strength. It may seem daunting, but it is
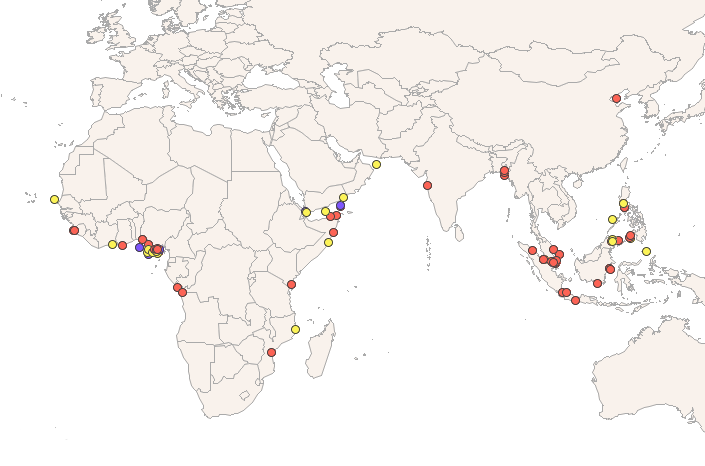

International Talk Like a Pirate Day is Sept 19 ... which always gets me thinking and wondering about modern-day pirates. Most movies usually focus on pirates from the Golden Age of piracy (a couple hundred years ago), when pirates typically stole ships and booty (treasure). But modern day pirates usually board


What’s new and what’s on the horizon for machine learning and analytics? We asked Kirk Borne, Principal Data Scientist and Executive Advisor at Booz Allen Hamilton, what machine learning technologies he’s watching. He focused his reply on applications, not algorithms. “When I think about what’s new and coming up, I


In my first post of this blog series, we learned how three education customers are using SAS. Today, we'll hear about the positive impact that SAS and analytics are providing for users and the education institutions. In this post, you'll hear from: Linda Sullivan, Assistant Vice President for Institutional Knowledge Management,


This post shows a variety of techniques including how to use PROC TEMPLATE and the SOURCE statement, PROC SGPLOT with multiple Y-axis tables, create comparable axes in two side-by-side graphs, create a broken axis, write and use a table template that wraps text, and find and display examples of certain statements in graph templates and fonts in style templates.
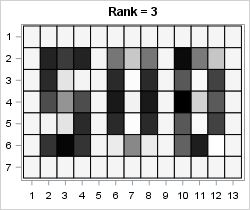
A previous article discussed the mathematical properties of the singular value decomposition (SVD) and showed how to use the SVD subroutine in SAS/IML software. This article uses the SVD to construct a low-rank approximation to an image. Applications include image compression and denoising an image. Construct a grayscale image The
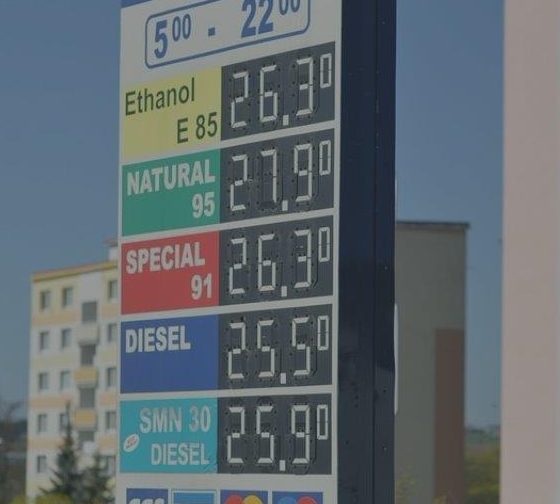

In the recent article, “Price-bots can collude against consumers,” the Economist discusses the consumer effects of prices set by price-bots. The article starts with an example of gasoline pricing strategies on Martha’s Vineyard. With a small number of gas stations on the island, the price-bots can cover all competitor prices frequently