All Posts


みなさんは「STEM」という言葉をご存知でしょうか。 これは、Science, Technology, Engineering, Mathematics の頭文字を合わせた言葉で、いわゆる「理系」から医学・薬学を除いたものをイメージすれば分かりやすいでしょう。 近年、ビッグデータ、データサイエンス、人工知能という言葉がバズ・ワード化していますが、それらを扱う人材の確保のために、「STEM人材育成」「STEM教育」の重要性が叫ばれています。日本は、米国に比べてこれらのデータ活用分野の遅れがあると言われていますが、STEM教育についてはどうでしょうか。 平成28年の日本の学生数の分布を見ると、工学16%、理学3%の19%の学生がいわゆる「STEM学部」に在籍していると言えます。一方、全米教育統計センターのデータを見ると、2014-2015年の学部の学位数は、8.5%がNatural science and mathematics (理学に相当)、9.2%がComputer science and engineering (工学に相当) となっています。全学生に対するSTEM教育を受ける学生の割合としては、日本と米国であまり差は無いようですが、工学と理学の割合が大きく異なり、日本は圧倒的に工学のほうが多くなっています。これは、日本が「ものづくりの国」である(あった!?)ことに由来するかも知れません。 閑話。 意外かもしれませんが、STEMには「心理学」も含まれています。「心理テスト」や「カウンセリング」のイメージが強い心理学ですが、実は、これらは心理学の一部分で、特に「実験心理学」と呼ばれる領域では、人間(場合によっては動物)の心理・行動について実験によりデータを集め、統計学を駆使して解析を行います。データサイエンティストをお探しの人事担当者さま、心理学専攻の学生は狙い目かも!? 閑話休題。 データを見る限り、日本でSTEM教育を受ける学生の割合は、米国と比較して圧倒的に少ないわけではないようです。OECDにおける学習到達度調査でも、義務教育修了段階の科学リテラシーや数学的リテラシーは、日本は国際的に上位グループに属しています。それでは、ビジネスにおけるデータ活用分野で、STEM人材活用が遅れているとされる理由は何でしょうか。 もしかしたら、それは大学の質にあるのかもしれません。米国ノースカロライナ州立大学の Master of Science in Analytics (MSA) では、アナリティクスの即戦力となる人材育成を進めています。まず注目していただきたいのは、就職に関するレポートをはっきりとデータで示していることです。特に、この修士号を取ることの投資対効果(ROI)を算出し、「21ヶ月で元が取れる」「3年のROIは$127,500」と、このプログラムに参加することの意味を、就職先を見据えて提示しています(上記レポートp.10)。逆に言えば、MSAに入学する学生は、アナリティクスの世界で活躍することを最初から目指しており、学習のモチベーションは非常に高いと想像できます。 もちろん、就職先で発揮できるスキルを養成することだけが大学の役割ではありません。しかしながら、多くの学生がアカデミックな研究の道ではなくビジネスの世界に進む以上、このような大学も一定数存在してもよいように思います。 また、この修士コースで特筆すべきは、Practicum という実践的プロジェクトがカリキュラムに含まれていることです。このプログラムでは、2017年現在、110以上のスポンサーが156ものプロジェクトを提案しています。スポンサーは実際の企業における具体的な課題をデータとともに提供し、学生は4-5名のチームとなってこの課題に8ヶ月かけて取り組み、最終的なレポートをスポンサーの前でプレゼンテーションします。このような実践的なプロジェクトを通して、学生はデータ分析のスキルと課題解決の方法を学びます。 日本においても、筑波大学ではこのような実践的な産学連携講義の取り組みを開始しており、SAS Japanでも昨年より分析環境の提供による教育支援をしています。データサイエンティストの育成を目指す大学教職員の皆様、実践的データ活用の講義を始めてみませんか? SAS Japan がサポートいたします。


When I was growing up, our family had a bookcase containing a set of encyclopedias - it was where I went to obtain information and facts about various things, to satisfy my curiosity and impress my friends. Now that we have the Internet, Wikipedia has taken the place of encyclopedias

2017年12月にSAS Viyaの最新版3.3がリリースされました。 これに伴い、皆様には、大幅に拡張されたSAS Viyaの機能を存分に体感いただくために今版から、皆様がお持ちの「実データ」でSAS Viyaベースのすべての製品を自由に触っていただけるようになりました。 ぜひ、ご利用ください! 利用手順に関しては、以下のブログをご覧ください。 SAS Viyaを体感してみよう! ~SAS Viya無償試用版利用ガイド~

¿El departamento de Tecnología de la Información (TI) de su empresa se puede considerar moderno? ¿Su labor se limita a mantener las cosas funcionando o es visto como un área de innovación real? Y en el caso de su líder, el director de TI (CIO), ¿qué papel está desempeñando para


56777906 - plan of soccer manager pointing to strategy tactical board A la industria de los juegos de azar y las apuestas les llegó el momento de empezar a usar el análisis de data y la estadística predictiva para ser más acertados a la hora de determinar la manera y
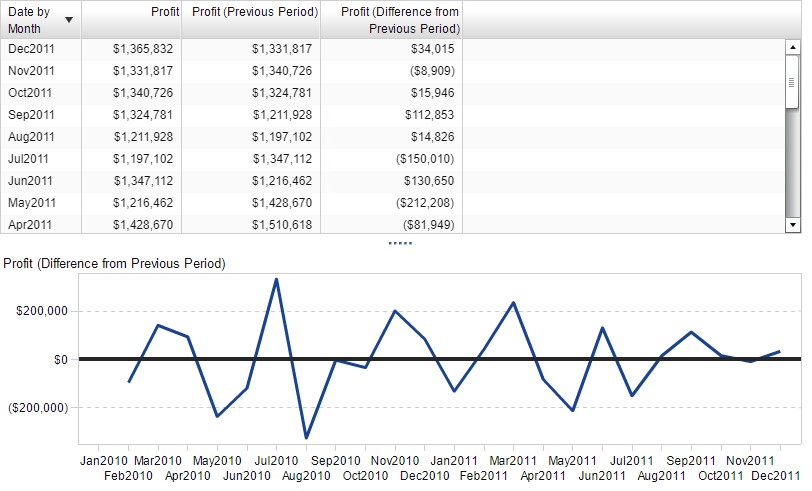

Another report requirement came my way and I wanted to share how to use our Visual Analytics’ out-of-the-box relative period calculations to solve it. Essentially, we had a customer who wanted to see a metric for every month, the previous month’s value next to it, and lastly the difference between


Los bancos siguen luchando contra el fraude de pagos, ya sean digitales o no. En los últimos años la tasa ha crecido a niveles que ya no se puede seguir permitiendo. Las falsas identidades son el principal factor para que los delitos se sigan cometiendo, usted pensará si SAS puede


Behavioral health information technology (HIT) adoption efforts have struggled and are still plagued by a number of challenges. Since 2011, the federal government has incentivized the industry to the tune of $37 billion. However, according to US Senator Sheldon Whitehouse (D-RI) “psychologists, community mental health centers, psychiatric hospitals, and others
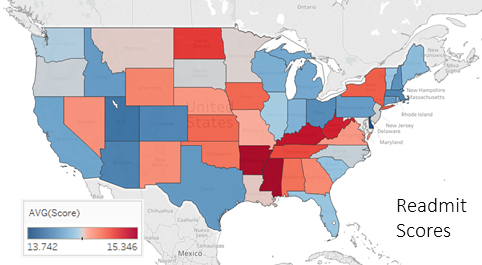

US health care costs are the highest in the developed world, despite per-capita healthcare spending roughly double that of the others, but with outcomes worse-or-equal-to comparable countries. A 2014 Commonwealth Fund study ranked the United States 11th out of 11 major industrial nations in overall healthcare. An aging population is
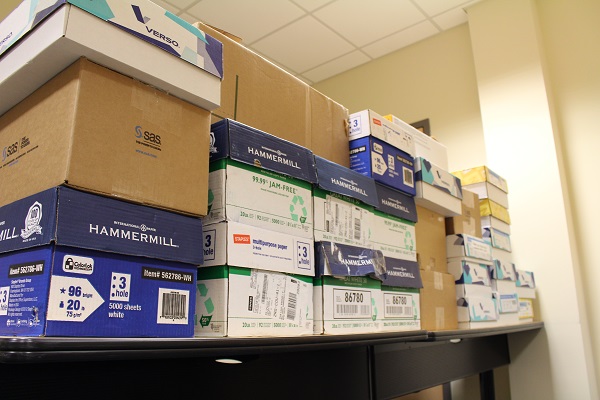

Well SAS, you outdid yourselves once again! For 6 years running, we've been collecting and donating leftover and excess Halloween candy from SAS families. After last year's record breaking 450 pounds of donated candy, we challenged you to raise the {candy} bar even higher this year...and man did you do that,
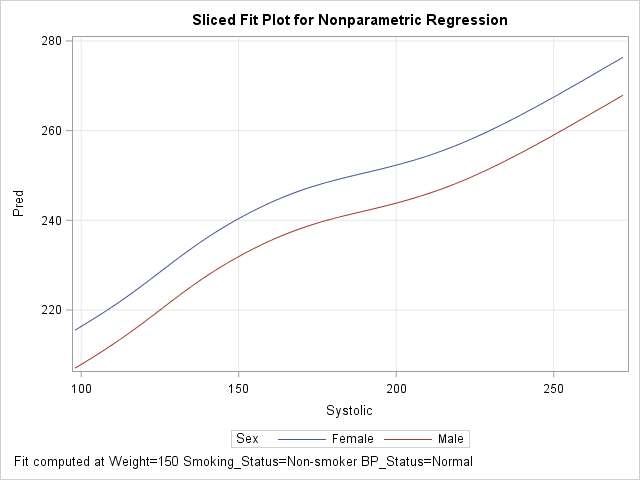

I previously showed an easy way to visualize a regression model that has several continuous explanatory variables: use the SLICEFIT option in the EFFECTPLOT statement in SAS to create a sliced fit plot. The EFFECTPLOT statement is directly supported by the syntax of the GENMOD, LOGISTIC, and ORTHOREG procedures in


En los últimos años, los algoritmos modernos de Aprendizaje Automático o mejor conocido como Machine Learning se han convertido en populares para el crecimiento en el poder de las computadoras y las comunidades de Código Abierto que permite las personas en su trabajo diario de una forma 'más fácil '.


While SAS program development is usually done in an interactive SAS environment (SAS Enterprise Guide, SAS Display Manager, SAS Studio, etc.), when it comes to running SAS programs in a production or operations environment, it is routinely done in batch mode. Why run SAS programs in batch mode? First and
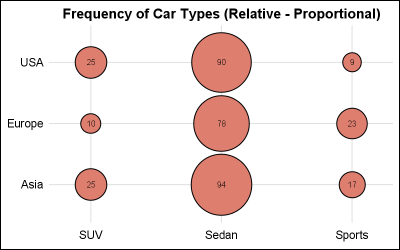

This is the 9th installment of the "Getting Started" series, and the audience is the user who is new to the SG Procedures. It is quite possible that an experienced users may also find some useful nuggets here. In this article, we will cover the basics of the BUBBLE plot.


In 2018, join us for lively discussions on thought-provoking books. We love to read and have each picked out great books that we hope you will enjoy too. Book Club discussions will be held from 12:00 - 1:00pm in the designated month. Check the Work/Life Calendar throughout the year for