US health care costs are the highest in the developed world, despite per-capita healthcare spending roughly double that of the others, but with outcomes worse-or-equal-to comparable countries. A 2014 Commonwealth Fund study ranked the United States 11th out of 11 major industrial nations in overall healthcare. An aging population is putting a further strain on both the health care system and the financing models in force – Medicare and Medicaid in the public sphere, and private health insurers such as Blue Cross Blue Shield, Humana, Cigna, Aetna and United Healthcare.
Both the government and the private insurers are moving to an emphasis on “value-based reimbursement agreements” with a focus on outcomes, costs, risk management and provider accountability – the best outcome obtainable in a cost effective manner.
A primary objective of this value-based approach is to reduce costs and improve quality and outcomes of care through the reduction of errors or care defects, including process failures, which can lead to readmissions and higher costs. Health care providers already focus on their 30-day readmission rates because of the penalties these trigger in their government reimbursements. One route to reducing these potentially preventable hospitalizations starts with standardization of healthcare treatment protocols built around agreed and established best practices.
For example, in today’s environment, if you're admitted to a hospital emergency department for, say, chest pains, once diagnosed you might get a dozen different treatment protocols from 12 different hospitals for the same diagnosis with varying numbers of steps and providers involved.
The premise behind value-based approaches is that if the hospital follows the agreed, standard best-practice treatment protocols they are likely to reduce readmission cases and realize financial benefits, and if they do not, they're more likely to suffer financial penalties. Expectations are that this approach will improve outcomes, lower readmissions and lower overall costs across the nation’s healthcare system.
To that end, I recently participated in a Data-4-Good exercise involving the analysis and interpretation of some hospital readmissions data collected from 2014 to 2015 by the Department of Health and Human Services as part of their Hospital Readmissions Reduction Program. I used SAS Enterprise Guide for the statistical analysis (see technical note below for details).
Our informal team was also able to obtain and integrate additional data regarding population from the Census Bureau, and a number of health risk factors, such as smoking, obesity, poverty, median household income, unemployment and education from various other sources – all publicly available. The six primary readmissions events being tracked by the Dept of HHS were: Heart failure, COPD, pneumonia, acute myocardial infarction (AMI), coronary artery bypass graft (CABG) and stroke.
Findings and observations
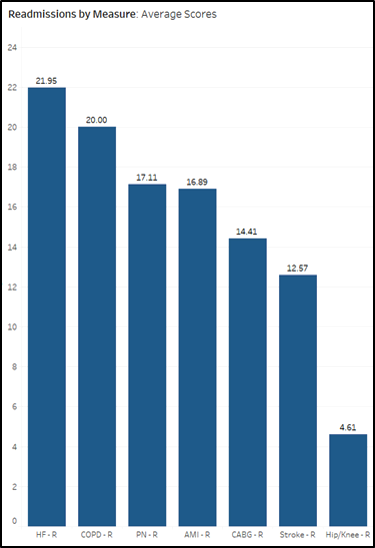
Before we move into the key findings, a brief tour of the landscape would help. The bar chart above shows the average readmissions scores for the six primary measures mentioned above, plus the relatively low-risk hip/knee replacements. At 21.95, heart failure has the highest average readmission score, followed by COPD, with CABG and strokes at the lower end of the scale.
NOTE: Lower = better, and the score is not simply a readmissions “rate,” but incorporates that rate along with other factors as well. As it says on the medicare.gov website: “To make comparisons fair, hospitals’ 30-day readmission results are 'risk-adjusted' to account for differences in hospital patients’ characteristics that may make readmission more likely, including age, gender, past medical history, and other diseases or conditions that patients had when they arrived at the hospital.”
While average hospital-wide readmissions scores at the state level range from 13.7 (Delaware/Utah) to 15.3 (Mississippi/Arkansas), individual hospitals covered a wider span from 10.8 to 19.9. The six measures themselves, at the individual hospital level, range from a high (worse) of 31.3 for heart failure to a low (better) of 9.1 for strokes (and 2.4 for the less critical hip/knee replacements).
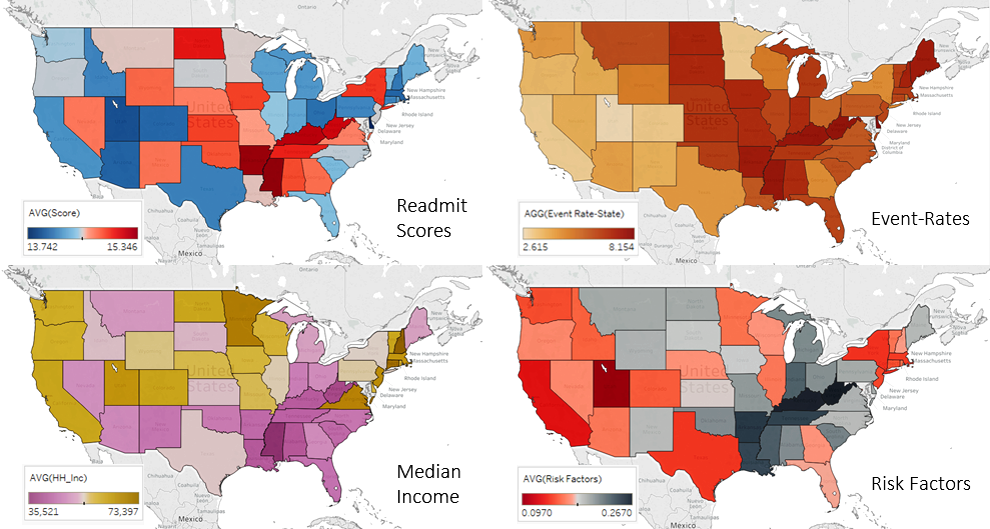
Some of the most significant relationships become apparent in the geographic visualizations above – between readmission scores, event-rates (admissions as a percentage of population), median income and general health risk factors. General health risk factors (i.e. smoking, obesity, poverty, etc …), were highest in West Virginia and Kentucky and lowest in Utah, and map almost exactly with the event-rates and are similarly associated with the readmission scores and median household income.
Lastly, before I attempt to draw some tentative conclusions, here’s a handful of moderately significant observations derived from the data.
- While there are some low-to-moderate correlations among the six measures (0.10 to 0.39), to be expected when so many of them are heart disease related (heart attack, CABG and AMI), the single strongest correlation, at 0.44, was between heart failure and pneumonia.
- Although not discussed above as they were less relevant to the principle cost analysis theme of the study, the HHS data also came with mortality scores for these same six measures, so it was possible to run a correlation analysis of readmissions scores against those for mortality. While most of the one-to-one correlations (i.e. COPD-M with COPD-R) were negligible, one did stand out with a relatively small but noticeable figure of 0.23, that being CABG mortality with CABG readmissions.
- Smoking shows a whopping 0.96 correlation coefficient with general health, followed by obesity at 0.72
- Most risk factors, such as smoking and obesity, show only minor correlations with overall readmission rates/scores (single digits) - the highest correlations with readmission rates are from unemployment and poverty, 0.16 and 0.10 respectively – which suggests that access to employer-provided medical insurance may be key in providing the necessary resources and access to post-discharge follow-up care not available to the uninsured who rely primarily on only the emergency department.
- Although not part of the intended study, a casual perusal of the data at the county level shows that not only are the highest number of cases directly associated with population for the largest counties such as Los Angeles, Cook and Harris as one might expect, but the case load is also clearly higher in counties with higher elderly populations, like the Palm Beach/Broward/Miami-Dade cluster in southern Florida, with Maricopa in Arizona comprising a bit of both.
These represent just some of the take-a-ways from visualization of the data and the applications of basic descriptive statistical techniques; clearly a more formal study and analysis would be required to assess cause-and-effect, and without a literature search to put this into context, other research may have already addressed some or all of these issues.
Remarks
A value-based reimbursement approach to controlling health care costs, incorporating and incentivizing the standardization and application of best practice treatment protocols, along with an “episodes of care” basis for analyzing and determining those best practices, will almost certainly have the intended beneficial effect and is a worthwhile endeavor in its own right.
However, as this data suggests, especially notable from the visual geographic comparisons at the state level, this alone may not be enough to deal with the overall total cost situation and likely does not get to root cause issues. The data suggests that there may be a significant bang-for-the-healthcare-buck in addressing the underlying health issues and risk factors. Reducing total costs will require attending to the primary factors that lead to hospitalization in the first place – smoking, obesity and general health among others, and reducing readmission costs may necessitate an emphasis on addressing poverty, unemployment and other socioeconomic determinants of health, which seem to be at least weakly related to having these patients return to the hospital.
In the end, before imposing significant financial consequences on hospital reimbursement models, with likely spillover consequences for the communities they serve, it might be wise to consider the possibility that a lack of best practices is not the only driver of costly readmissions.
Technical Footnote: The primary statistical analysis for this study was accomplished using SAS® Enterprise Guide®. As you might expect, the bulk of the effort to produce these results was in the data preparation - 42,000 usable observations, covering data from 4,400 hospitals, plus over 40 analysis variables. Once loaded into SAS Enterprise Guide, the menu-driven, drag-and-drop capability meant that you could answer questions almost as fast as you could ask them. A slight variation to a prior investigation involved nothing more than clicking on that icon in the workspace, selecting Modify Task, substituting one variable with another and hitting RUN. Summary statistics, scatter plots, correlations and regression were all employed to explore the dataset for insights from the unknown-unknowns (not to mention how easy it made the transformations and joins required to properly prepare the data for analysis). All performed by a former finance and current marketing guy with nothing more than a working knowledge of basic statistics and a little user-oriented training on SAS Enterprise Guide.

1 Comment
Very interesting article. Thanks