All Posts


Una sucursal bancaria y un campo de fútbol. Un contragolpe y una compra de cartera. Los nuevos banqueros y las estrellas nacientes del balompié. Parecen palabras apenas puestas juntas, elementos de dos mundos muy diferentes, comparaciones imposibles. Sin embargo, durante la 4ª Convención Latinoamericana de Analítica organizada por SAS en


Joyce Norris-Montanari talks about how to implement data privacy policies, procedures and guidelines.


Retailers don’t need to be reminded about the importance of customer experience. It’s critical – and that’s been true since the dawn of retail. But the nature of that experience has been changing at a rapid clip in recent years, due in large part to well-documented shifts in technology and
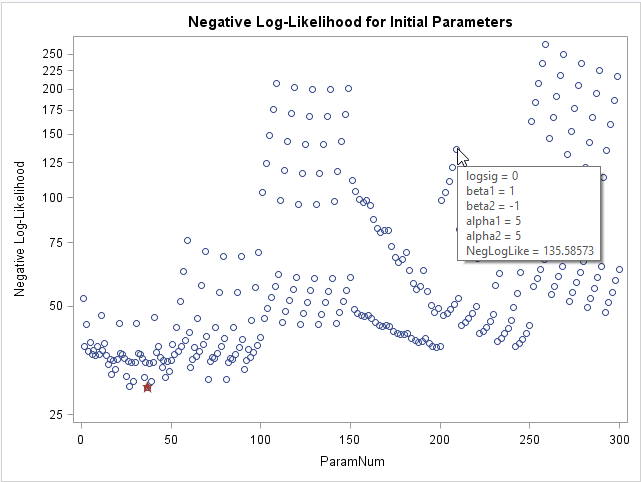

When you fit nonlinear fixed-effect or mixed models, it is difficult to guess the model parameters that fit the data. Yet, most nonlinear regression procedures (such as PROC NLIN and PROC NLMIXED in SAS) require that you provide a good guess! If your guess is not good, the fitting algorithm,


La economía digital surgió a raíz del avance de la tecnología en la informática y las telecomunicaciones. El último Modelo de Gestión de Riesgos de Seguridad Digital entregado por el Ministerio de Tecnologías de la Información y las Comunicaciones -MinTIC-, afirma que en los últimos 20 años el acceso a


There are many ways to avoid transcoding problems when you have national language characters in SAS programs that you save from a SAS®9 (English) session and move to a UTF-8 environment. In this article, we'll share tips to help you avoid such issues.


스포츠 클럽은 다양한 소스로부터 수많은 데이터를 수집합니다. 선수들의 건강 상태에 대한 물리적 데이터, 의료 정보, 득점이나 경기 시간 등의 성과 데이터가 대표적인데요. 이외에도 티켓 가격, 판매, 시즌권 패턴 등 팀 운영 측면에서 다양한 데이터가 모입니다. 스포츠 클럽은 이전에도 데이터를 활용해왔습니다. 경기 장면을 촬영하고 실시간으로 또는 경기가 끝난 후 주요 영상(footage)을


Neste mundo cada vez mais competitivo e comercialmente agressivo, é notória a preocupação da gestão de topo das organizações em criar mecanismos e estratégias que garantam uma visão integrada e holística dos seus clientes. Já tinha sentido que as suas campanhas de captação não estão a resultar? São cada vez


To reference CAS tables using a one-level name we will issue two statements that alter which libref houses the tables referenced as one-level names.
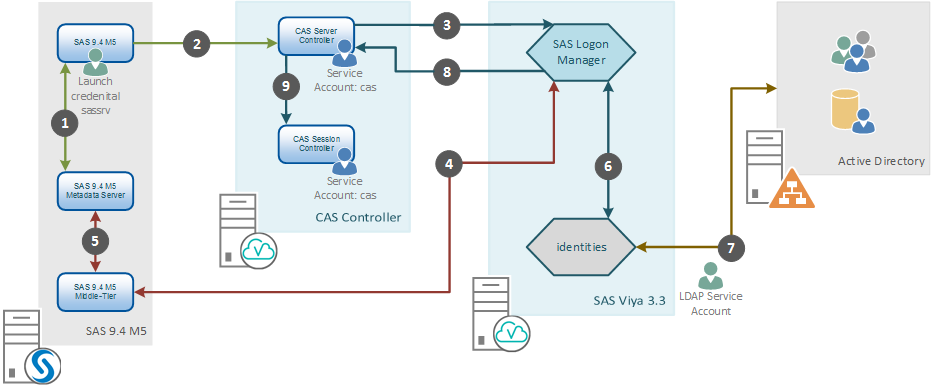

This post addresses connecting to SAS Viya using a One-Time-Password generated by SAS 9.4. We'll learn more about SAS Viya connecting with SAS 9.4 and talk about how this authentication flow operates and when we are likely to require it.
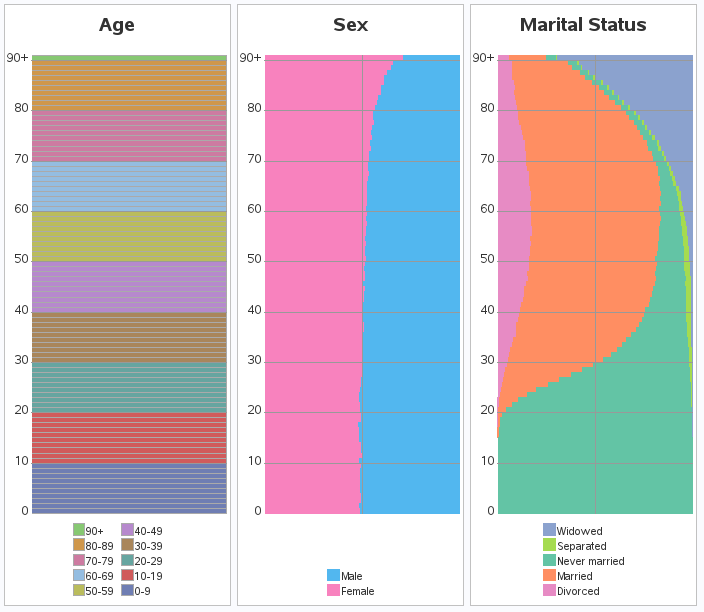

A question recently popped up in a discussion forum about creating table plots using SAS. So I thought I'd dabble in this topic, and see what I could come up with. If you're interested in tableplots, or American Community Survey (ACS) data, or data visualization, I invite you to follow
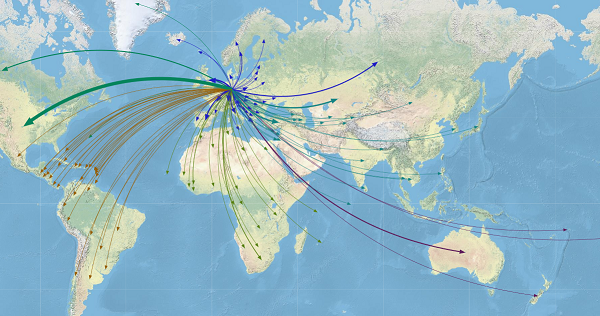

More than 3.5 percent of the world’s population is on the move, considered international migrants. That’s more than 250 million people living in a country different than their country of birth or nationality. To put that another way, if all migrants lived in a single country, their population would be
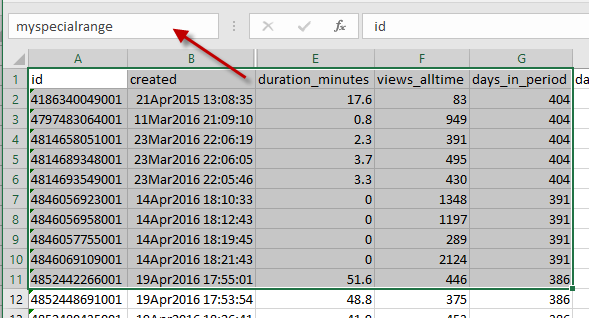

I've said it before: spreadsheets are not databases. However, many of us use spreadsheets as if they were databases, and then we struggle when the spreadsheet layout does not support database-style rigor of predictable rows, columns, and variable types -- the basic elements we need for analytics and reporting. If


Our company talks to utilities all over the world about the value of analytics. We like to talk about "the digital utility" and break down analytics use cases across: assets and operations; customers; portfolio; and corporate operations. I plan to highlight a few analytics use cases for utilities across these four areas
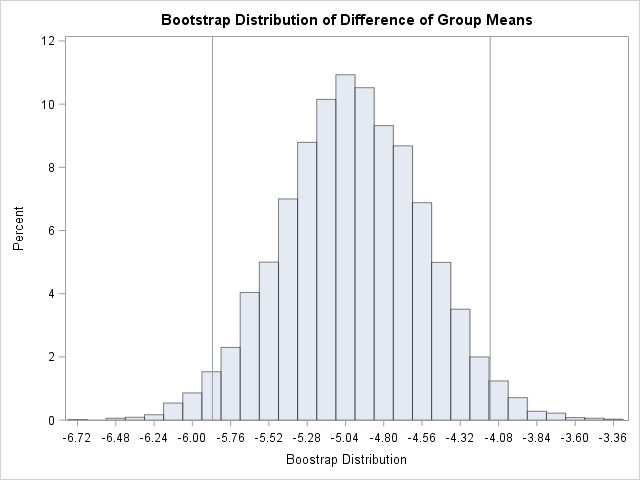
A previous article provides an example of using the BOOTSTRAP statement in PROC TTEST to compute bootstrap estimates of statistics in a two-sample t test. The BOOTSTRAP statement is new in SAS/STAT 14.3 (SAS 9.4M5). However, you can perform the same bootstrap analysis in earlier releases of SAS by using