All Posts

나만의 파라다이스를 찾아라! 여름 휴가 계획 모두 세우셨나요? 어디로 갈지 아직 고민 중이시라면! 클릭 몇 번만으로 전 세계에서 나와 가장 잘 맞는 도시를 알려주는 ‘SAS 파라다이스 파운드(SAS Paradise Found)’ 프로젝트를 소개합니다. 사람마다 매력적인 여행지와 거주지를 선택하는 기준은 다르기 마련인데요. SAS 파라다이스 컨피규레이터(Paradise Configurator)는 가족, 문화, 자연, 안전 및 인프라, 생활비, 레스토랑


How important is the customer experience in communications today? “Very important” is an understatement. It should be the top area of focus for all communications providers. It’s no secret that when customers are extremely satisfied, they become brand champions for the companies that provide them the products and services they


My preferred nomenclature was just plain “Grandma.” Because my name is Angie, my four daughters thought “Grangie” would be fitting. I didn’t love this one. Ultimately, my first granddaughter chose my name: “Mah Gah.” I was concerned initially that her swapping syllables from “Grandma” to “Mah Gah” might indicate early
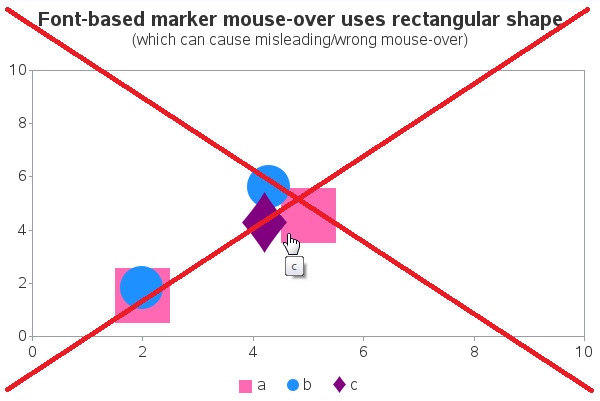

There are many quotes with words of wisdom to help you live your life. But sometimes one quote seems to contradict another. For example, "Don't sweat the small stuff." ... and "The devil is in the details." When it comes to creating graphs (and perhaps living my life in general),


Looking for use cases for analytics to derive value at an electrical utility? We have identified over 125 ways you can use analytics to improve the business processes at an electric utility. I recently posted a series of blog posts discussing four different use cases. Now I'd like to share


Some say building a network is a form of art. If that’s true, then Joshua Richardson is on his way to becoming a master! Joshua’s been with SAS since he graduated college in 2016. And he’s hit the ground running - already leveraging his growing network and relentless curiosity to
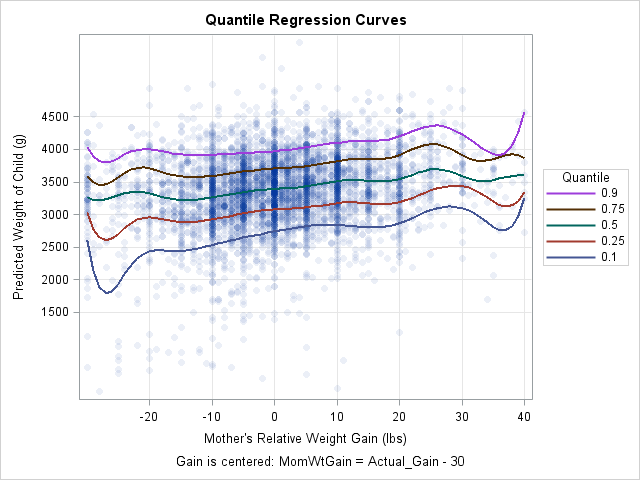

This article shows how to score (evaluate) a quantile regression model on new data. SAS supports several procedures for quantile regression, including the QUANTREG, QUANTSELECT, and HPQUANTSELECT procedures. The first two procedures do not support any of the modern methods for scoring regression models, so you must use the "missing


La evolución tecnológica a la que nos enfrentamos a diario ha generado grandes cambios en los hábitos de consumo. Estas transformaciones han llevado a las organizaciones a atravesar por un momento en el que si no evolucionan no podrán optimizar, por ejemplo, la experiencia al cliente que ofrecen, y de


For part 7 of this series, I had the pleasure of interviewing mathematician, former colleague, and data science “rock star” Longhow Lam. Since there’s no need for an office for his one-person company, we decided to meet for lunch in a very hot (31 degrees) and sunny Amstelveen city


SAS Expected Credit Loss es la plataforma integral y modular de SAS que permite atender los requerimientos de IFRS 9: desde la gestión de datos, el modelado y la estimación del deterioro hasta la previsión, la contabilidad y la generación de informes. Adicionalmente, ayuda a las organizaciones a implementar una
In many movies, there is often a scene where the star says "We can do this the easy way, or the hard way" (and the hard way usually involves quite a bit of pain). So it is with interrogations ... and so it is with writing SAS code! Today I'm


Soccer has been on my mind since the recent tournament in Russia, and fraud is always on my mind. Fighting fraud today means thinking about artificial intelligence (AI) and machine learning (ML). Everyone says so. Like me, you probably wonder how AI and ML work – especially in fraud. What

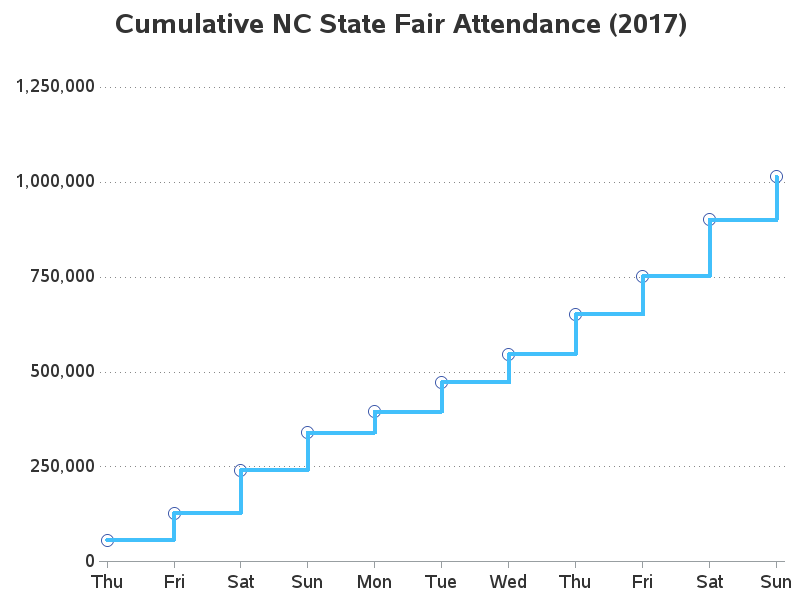
Recently, Scott Jackson, Director Business Intelligence at the University of North Carolina at Chapel Hill shared their data quality, reporting and analytics journey. They're using SAS in a multitude of ways – from operations, institutional research, athletics – and are now looking to scale to the enterprise. They've been so successful


"When your child 'comes out' to you, thank them. Thank them for loving and trusting you enough to share this important part of themselves with you. They have given you a gift, an opportunity to interact with them in an open and honest way. It means they want your approval


Several weeks ago, I wrote about practical advice from a Chief Data Scientist in my blog “From Aristotle to Pi: Practical advice from a chief data scientist.” Now I want to offer my advice as a newbie trying to navigate through machine learning concepts and how to code them. Over