All Posts

La economía digital surgió a raíz del avance de la tecnología en la informática y las telecomunicaciones. El último Modelo de Gestión de Riesgos de Seguridad Digital entregado por el Ministerio de Tecnologías de la Información y las Comunicaciones -MinTIC-, afirma que en los últimos 20 años el acceso a
There are many ways to avoid transcoding problems when you have national language characters in SAS programs that you save from a SAS®9 (English) session and move to a UTF-8 environment. In this article, we'll share tips to help you avoid such issues.

스포츠 클럽은 다양한 소스로부터 수많은 데이터를 수집합니다. 선수들의 건강 상태에 대한 물리적 데이터, 의료 정보, 득점이나 경기 시간 등의 성과 데이터가 대표적인데요. 이외에도 티켓 가격, 판매, 시즌권 패턴 등 팀 운영 측면에서 다양한 데이터가 모입니다. 스포츠 클럽은 이전에도 데이터를 활용해왔습니다. 경기 장면을 촬영하고 실시간으로 또는 경기가 끝난 후 주요 영상(footage)을

Neste mundo cada vez mais competitivo e comercialmente agressivo, é notória a preocupação da gestão de topo das organizações em criar mecanismos e estratégias que garantam uma visão integrada e holística dos seus clientes. Já tinha sentido que as suas campanhas de captação não estão a resultar? São cada vez

To reference CAS tables using a one-level name we will issue two statements that alter which libref houses the tables referenced as one-level names.
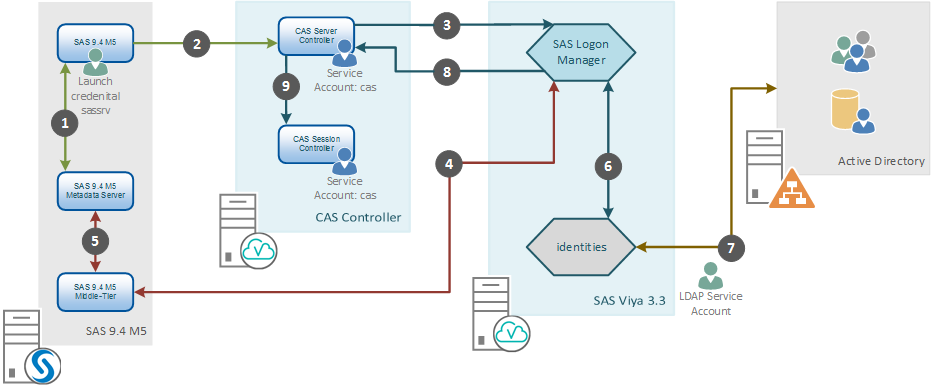
This post addresses connecting to SAS Viya using a One-Time-Password generated by SAS 9.4. We'll learn more about SAS Viya connecting with SAS 9.4 and talk about how this authentication flow operates and when we are likely to require it.
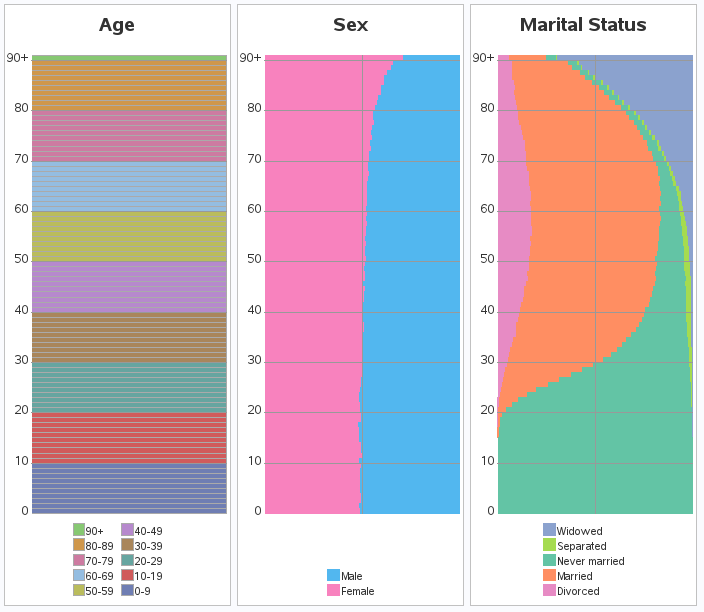
A question recently popped up in a discussion forum about creating table plots using SAS. So I thought I'd dabble in this topic, and see what I could come up with. If you're interested in tableplots, or American Community Survey (ACS) data, or data visualization, I invite you to follow
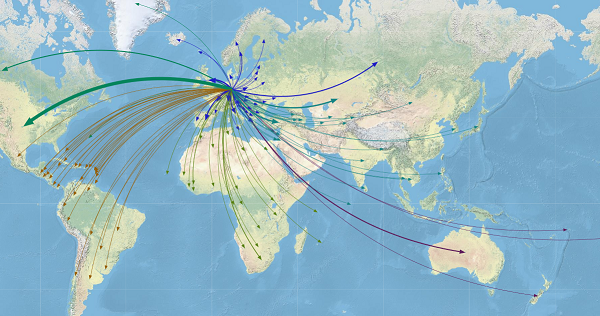
More than 3.5 percent of the world’s population is on the move, considered international migrants. That’s more than 250 million people living in a country different than their country of birth or nationality. To put that another way, if all migrants lived in a single country, their population would be
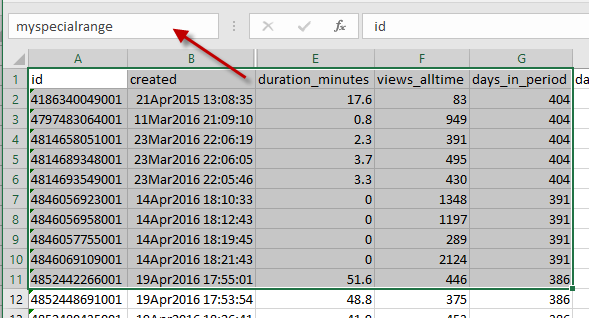
I've said it before: spreadsheets are not databases. However, many of us use spreadsheets as if they were databases, and then we struggle when the spreadsheet layout does not support database-style rigor of predictable rows, columns, and variable types -- the basic elements we need for analytics and reporting. If
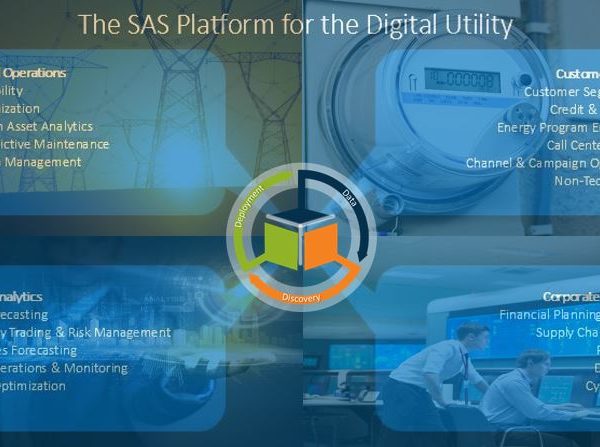
Our company talks to utilities all over the world about the value of analytics. We like to talk about "the digital utility" and break down analytics use cases across: assets and operations; customers; portfolio; and corporate operations. I plan to highlight a few analytics use cases for utilities across these four areas
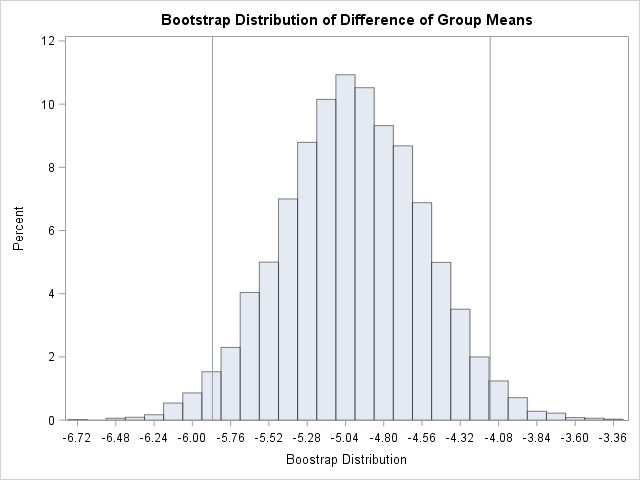
A previous article provides an example of using the BOOTSTRAP statement in PROC TTEST to compute bootstrap estimates of statistics in a two-sample t test. The BOOTSTRAP statement is new in SAS/STAT 14.3 (SAS 9.4M5). However, you can perform the same bootstrap analysis in earlier releases of SAS by using

Además de ser un recurso de gran impacto para las compañías, se ha demostrado que el análisis de datos también es importante para el sector deportivo. Equipos de fútbol, béisbol, básquetbol y hockey están adoptando la analítica de SAS para, por ejemplo, acercarse más a su fanaticada. Por ser un

A Internet das Coisas - IoT - veio para ficar. Segundo o estudo “2017 Internet of Things ROI Research Study”, levado a cabo pelo Internet of Things Institute (IoTi), em colaboração com o SAS, revela que a maioria das instituições inquiridas ainda estão numa fase inicial de implementação de IoT
Cloud Analytic Services (CAS) is really exciting. It’s open, multi-threaded and distributed. And, best of all for SAS programmers, it’s SAS. You can even run DATA Step in CAS. Here's more on how DATA Step work in a multi-threaded, distributed context.

Jim Harris says the GDPR may cause seismic changes in how people think of privacy and personal data.


