All Posts


Hoy en día, los modelos analíticos son la sangre vital de las instituciones financieras modernas. A través de ellos se toman diferentes tipos de decisiones que afectan las necesidades de diversos interesados. Derivadas de esas decisiones se pueden producir consecuencias adversas en las entidades financieras, tanto económicas como reputacionales, dando


Do you want to insert blank rows into your TABULATE procedure tables? Here's a SAS sample and two other methods that will get the job done.
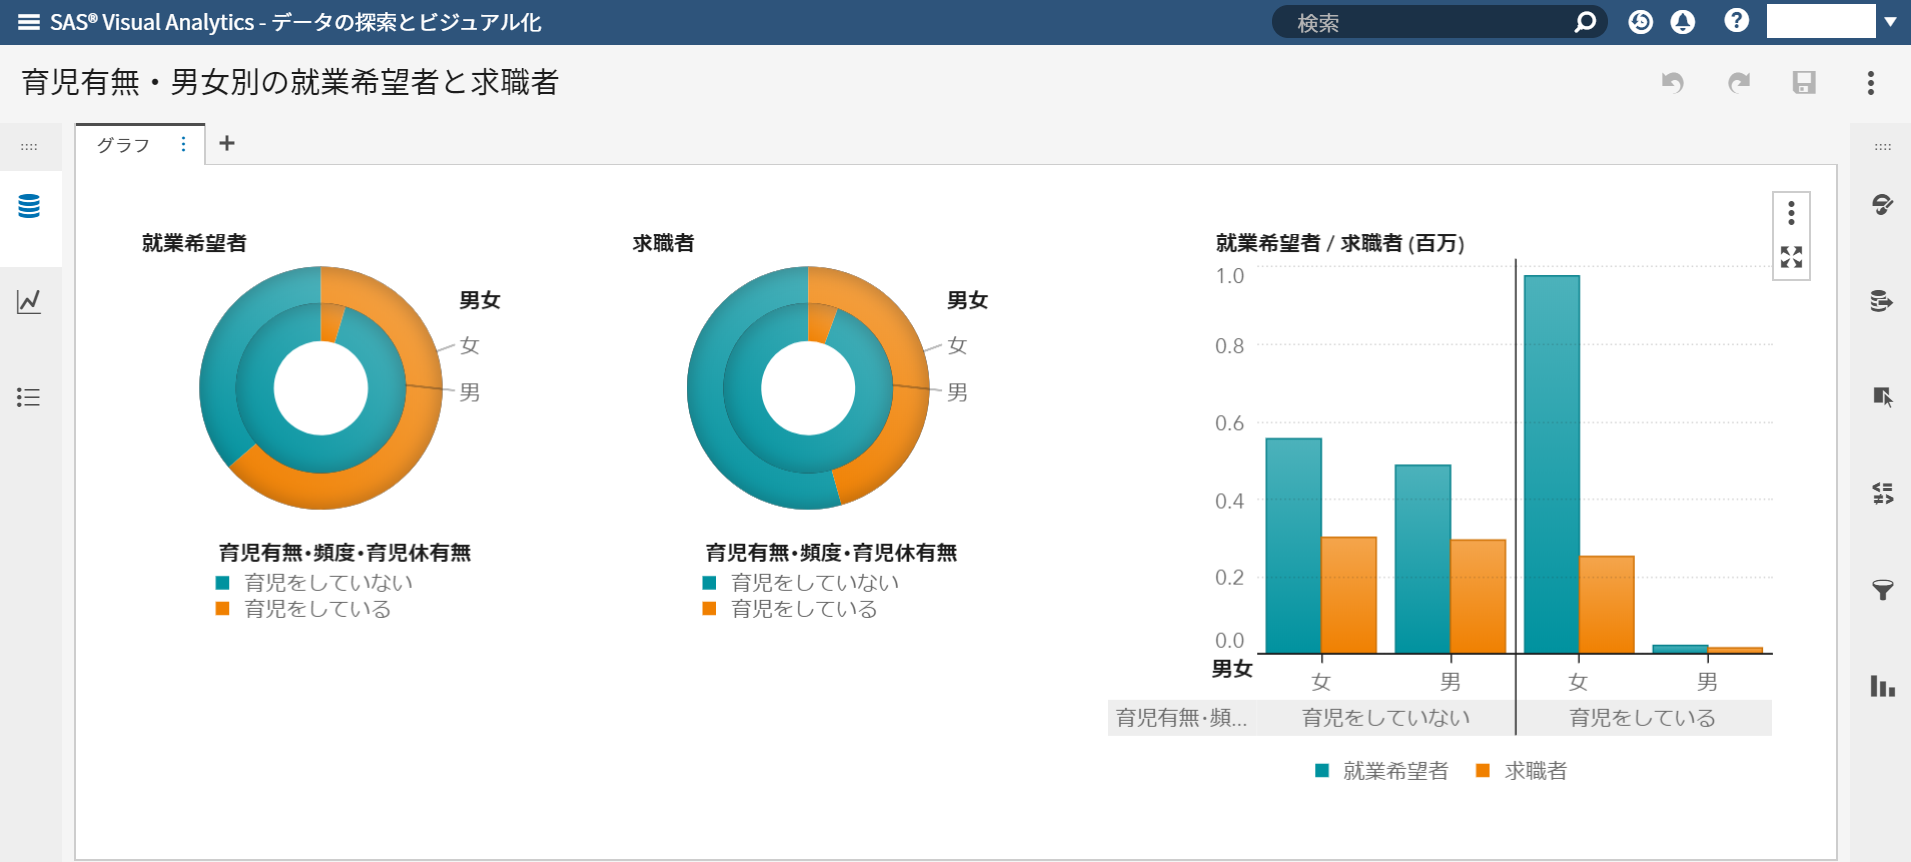

SAS Japan と伊藤忠テクノソリューションズ株式会社は、第2回和歌山県データ利活用コンペティションに共同で協賛し、参加者に「データサイエンス教育プラットフォーム」を提供します。 このブログでは、データサイエンス教育プラットフォームの利用例をシリーズで紹介します。 本コンペティションは次世代のデータサイエンティストを育成することを目的に開催され、全国の高校生及び大学生が腕をふるいます。データサイエンス教育プラットフォームでは、プログラミングを知らない学生でもデータ分析ができるように、データの取り込み、集計、基本的な統計解析、高度な機械学習手法などをビジュアルなインターフェースで実行できる SAS Visual Analytics をWebブラウザから利用できます。


Soy muy optimista en cuanto las perspectivas de adopción de la analítica avanzada en áreas como la inteligencia artificial (AI). Especialmente porque existe una verdad innegable: los tomadores de decisión son, en su mayoría, compañías que conocen la necesidad de incursionar en el uso de analytics para obtener procesos más


유럽 일반개인정보보호법(GDPR; General Data Protection Regulation)은 유럽연합(EU) 전역은 물론 유럽연합 시민의 개인 정보를 다루는 전 세계 모든 기업에 영향을 미치고 있습니다. 이 새로운 규제의 목적은 시민에게 자신의 데이터에 대한 보다 강력한 통제권을 부여하고, 유럽 전역에 걸쳐 시행할 수 있는 통일된 규칙을 만드는 것인데요. 이에 따라 기업은 개인 데이터 기록을 수집, 처리, 업데이트,


Referred to as the instigator of innovation, Mick Ebeling works to expand the human possibilities of technology through his company, Not Impossible Labs, whose mission is to change the world through technology and story. Powered by a team of thinkers, doers, creators and hackers, Not Impossible Labs works on inspirational
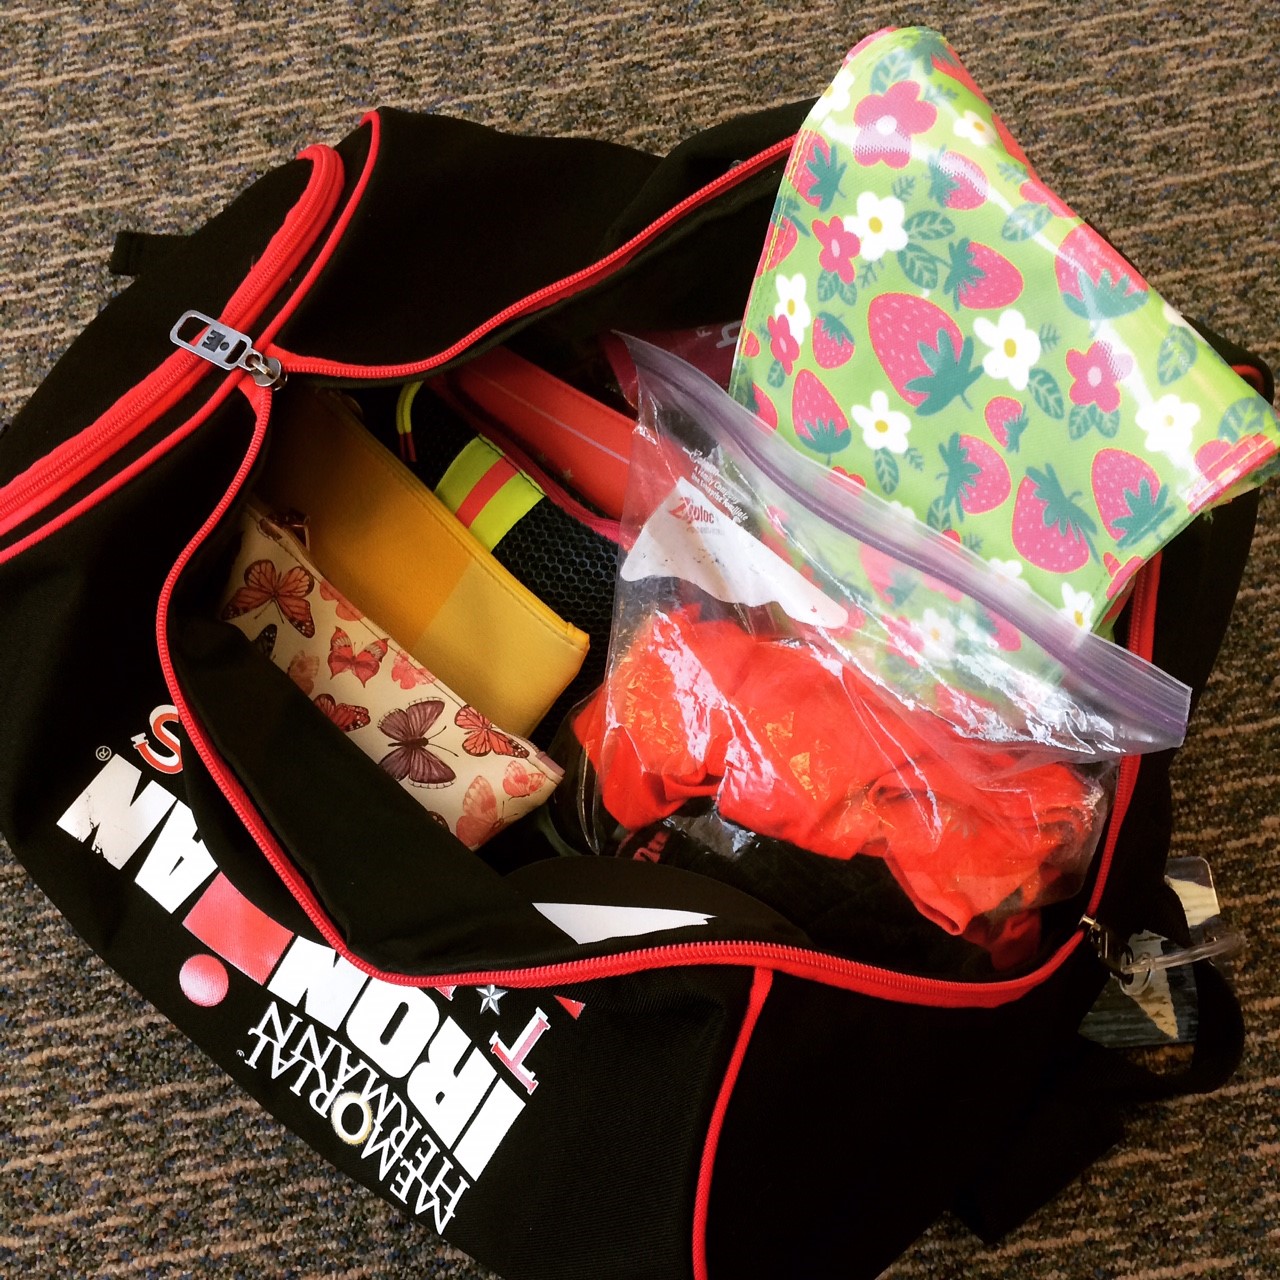

I'm grinning as I type this post. I’m sitting in my office, sweaty from a run with a fan blowing in my face. Today, I have time to grab a shower later, but most days I don’t. I go from teaching to meeting with a client to covering our fitness
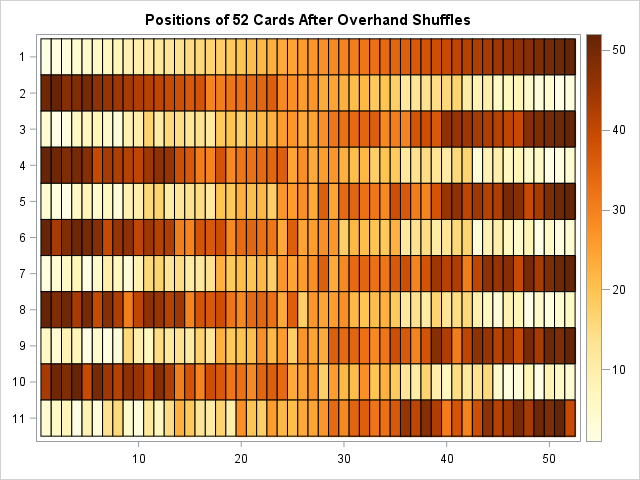

Every day I’m shufflin'. Shufflin', shufflin'. -- "Party Rock Anthem," LMFAO The most popular way to mix a deck of cards is the riffle shuffle, which separates the deck into two pieces and interleaves the cards from each piece. Besides being popular with card players, the riffle shuffle is


How can you use analytics to design better biopsies and improve outcomes? This high school student has some ideas, and she presented them at Analytics Experience 2018.
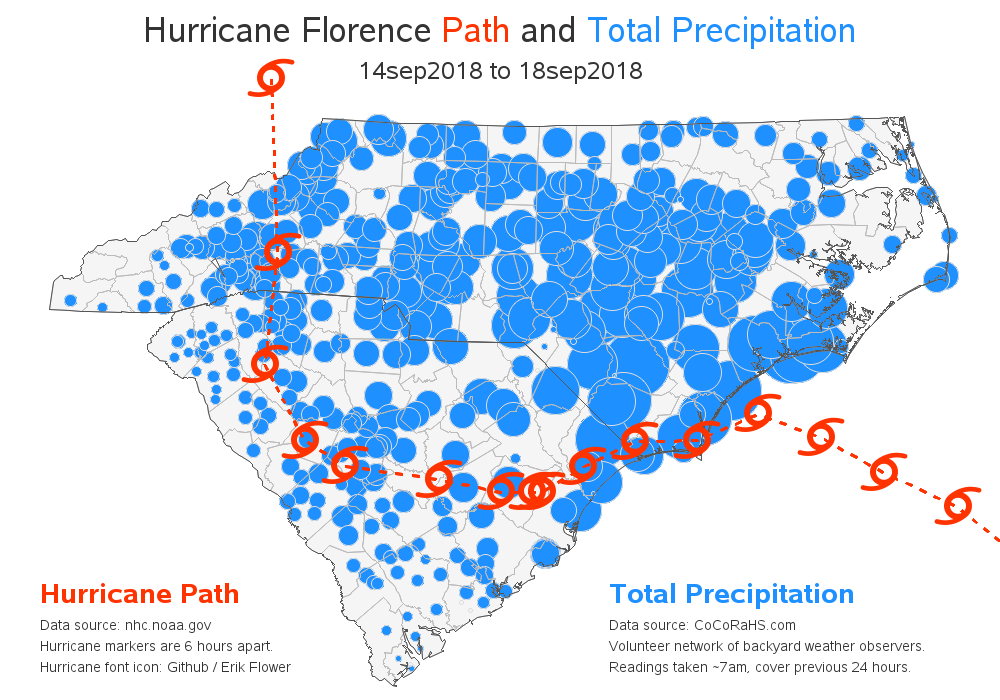

"We been through every kind of rain there is. Little bitty stingin' rain, and big ol' fat rain, rain that flew in sideways, and sometimes rain even seemed to come straight up from underneath." Was that a quote from the Forrest Gump movie, or something said regarding Hurricane Florence? Could be either one! Hurricane Florence recently came through
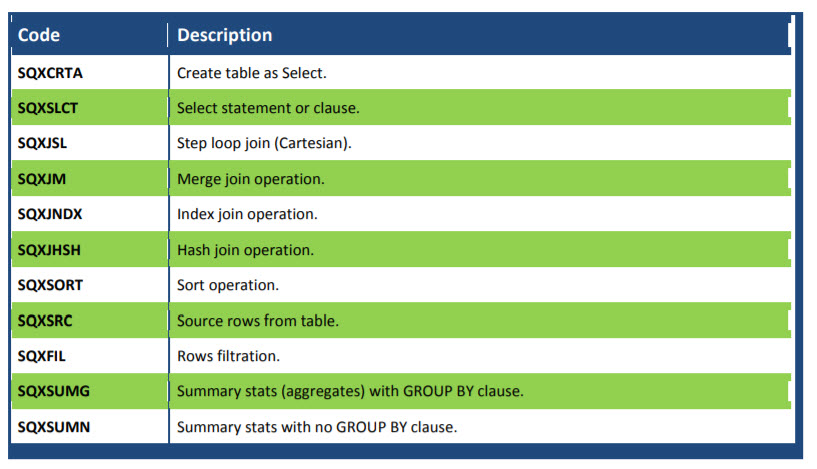

SAS Press author Kirk Paul Lafler's favorite tips using PROC SQL.


¿Hace cuánto que no acude personalmente a un banco a cambiar un cheque o hacer el pago de un servicio? Seguramente, le está siendo difícil recordar cuál fue el motivo de su última visita a la sucursal más cercana. Ahora bien, ¿cuándo utilizó por última vez el portal web de


Hurricane Florence slammed the Carolinas and neighboring states with storm surge, damaging winds, and catastrophic flooding. Many SAS employees are wondering how to help. There are many different ways to help provide support and relief to those impacted by the storm. Below are some ideas. When deciding how to give, it


데이터 사이언티스트들은 작업 시간의 대부분을 데이터 준비와 피처(feature) 엔지니어링에 할애합니다. 지난 블로그를 통해 데이터 준비 작업에 유용한 프로그래밍 팁을 소개해드렸는데요. 오늘은 인공지능(AI) 기반 엔터프라이즈 분석 플랫폼 ‘SAS 바이야(SAS Viya)’의 기본 템플릿 중 ‘자동화된 피처 엔지니어링 템플릿’을 활용해 손쉽게 예측 모델을 생성하는 방법을 살펴보고자 합니다. 피처는 입력과 변수(독립 변수, 설명 변수)를 의미합니다. 그리고 피처 엔지니어링은 예측
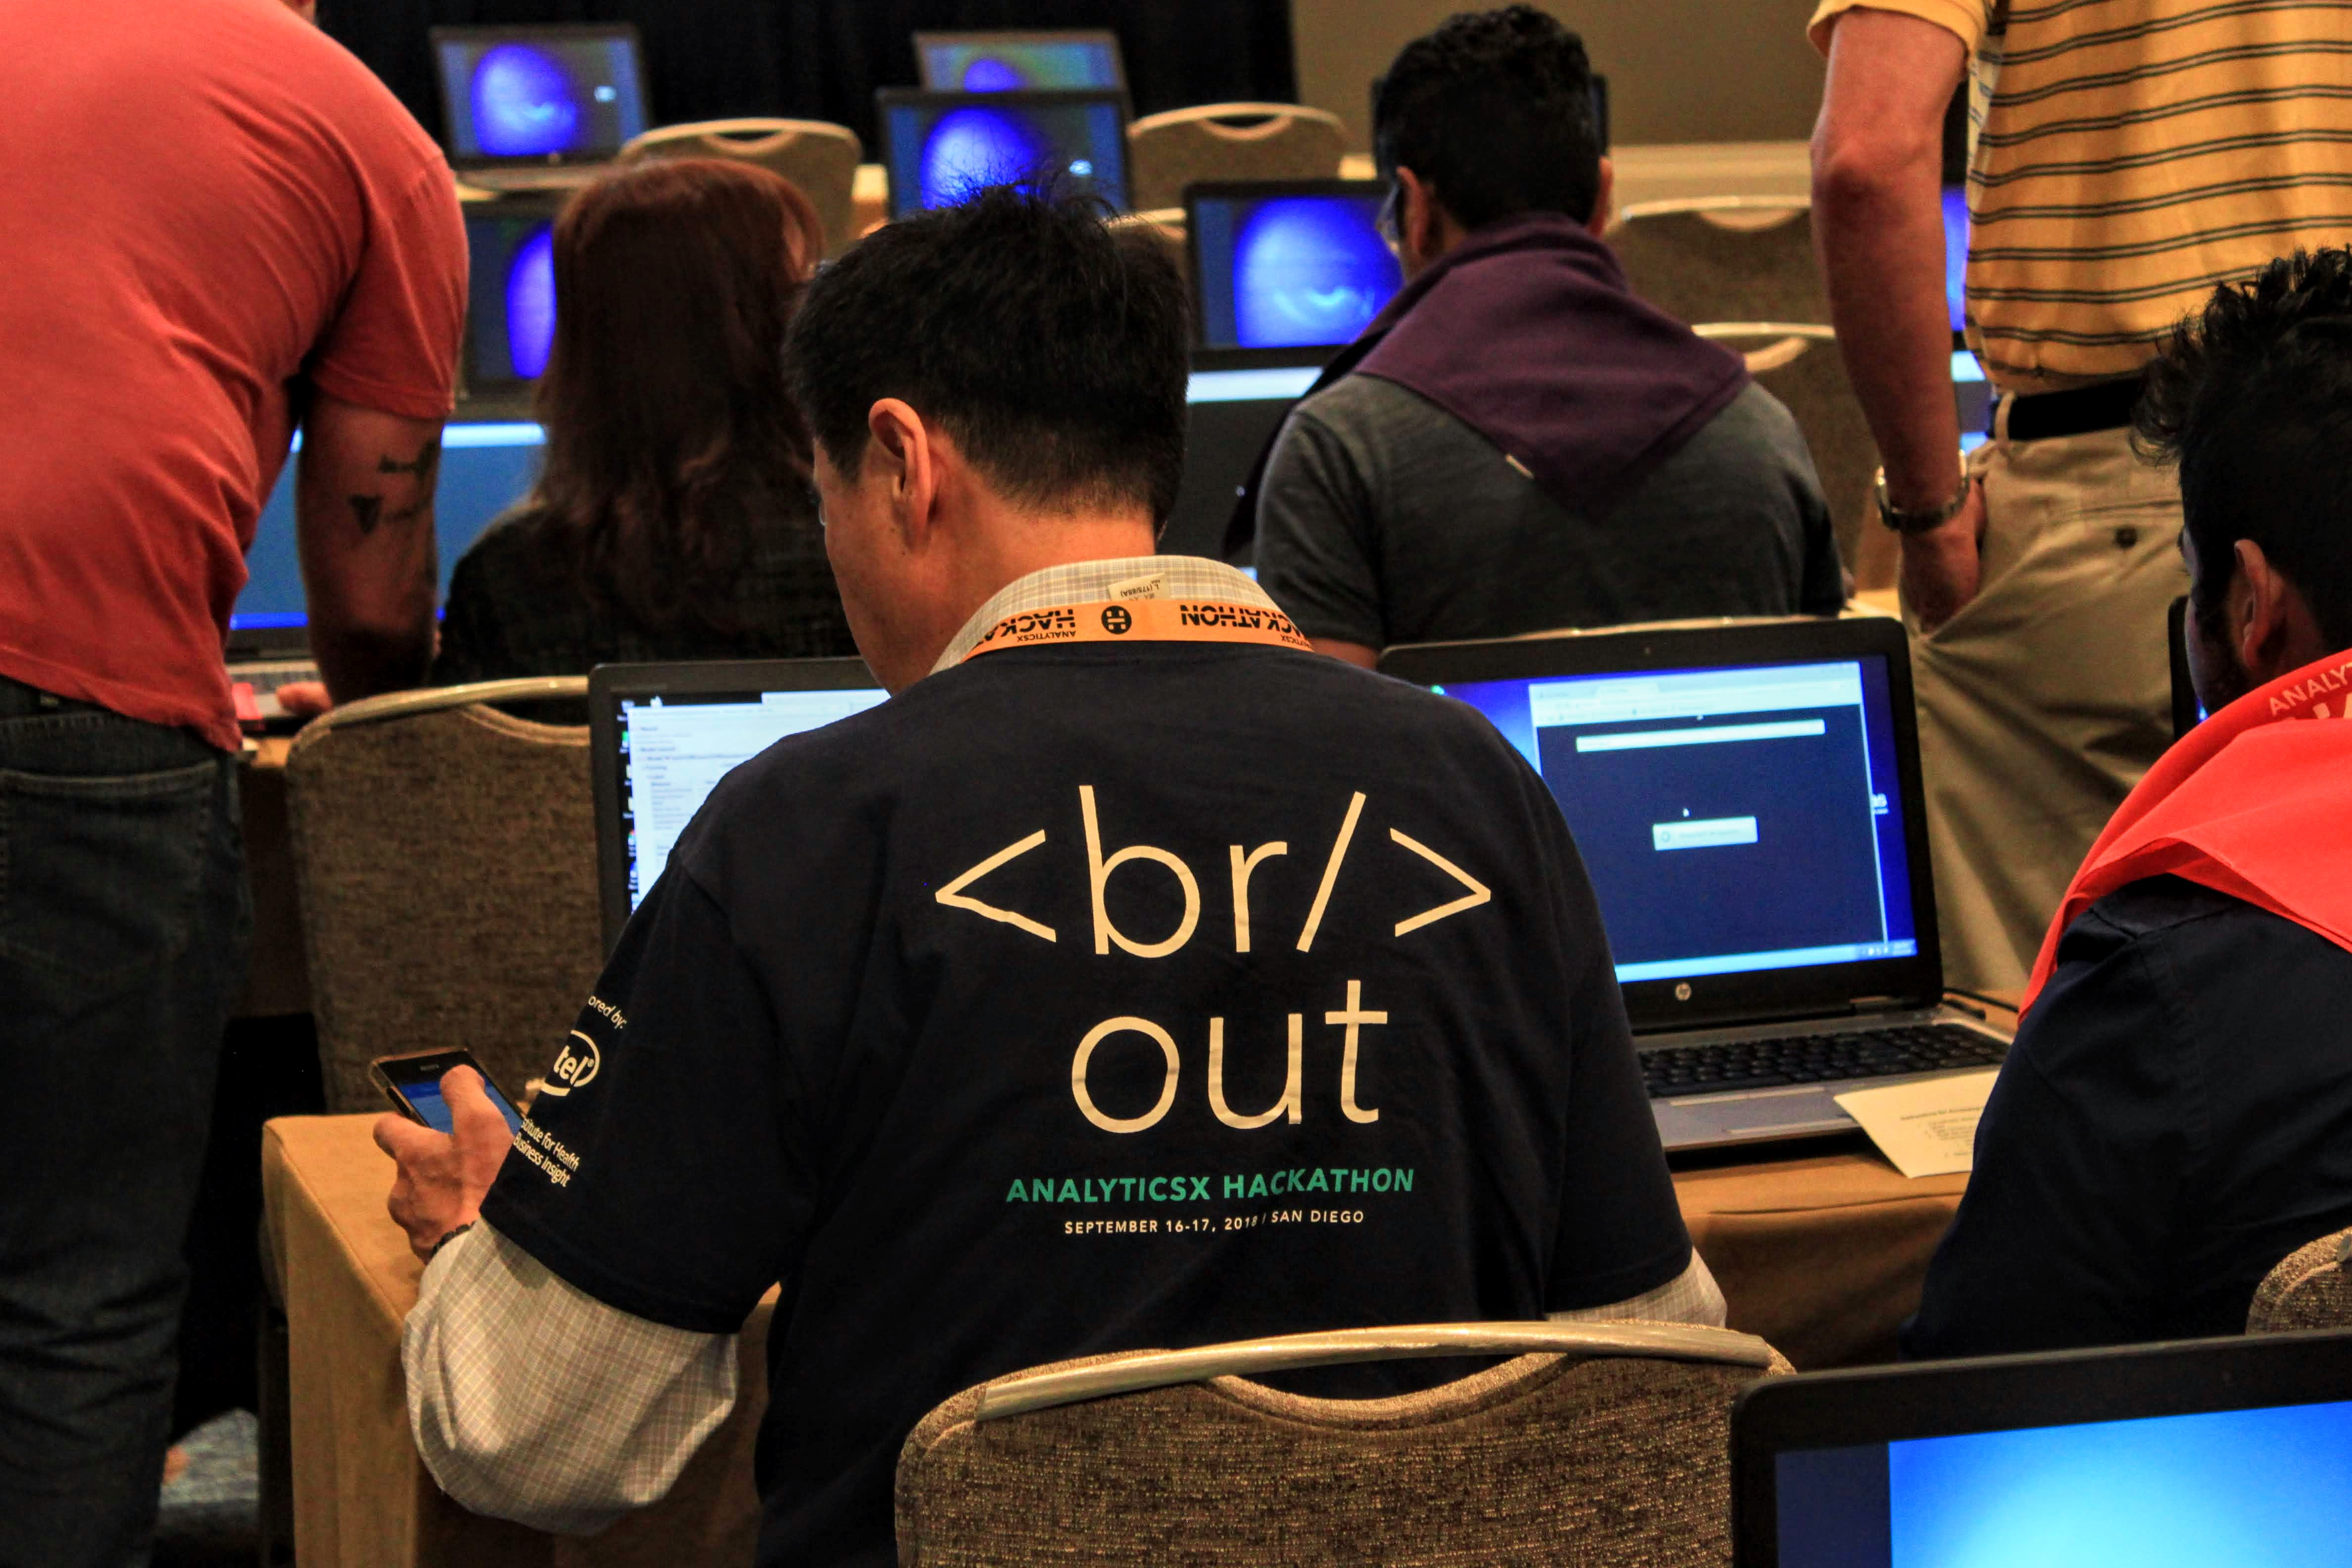
To succeed in any data-focused hackathon, you need a robust set of tools and skills – as well as a can-do attitude. Here's what you can expect from any hackathon: Messy data. It might come from a variety of sources, and won't necessarily be organized for analytics or reporting. That's