All Posts


인공지능(AI)의 성장은 과연 디스토피아를 초래할까요? 인공지능은 굉장히 빠른 속도로 발전하고 있지만, 동시에 인공지능의 잠재적 위험성을 우려하는 목소리도 커지고 있는데요. 하지만 반대로 생각해보면 인공지능은 인간의 능력을 대체하는 것이 아니라, 인간의 능력을 향상시키기 위해 설계되었습니다. 인공지능은 이미 헬스케어, 보험, 금융, 농업 등 대부분의 산업 분야에서 인간을 돕는 중추적인 역할을 하고 있는데요. 마찬가지로 SAS는 인공지능을


In my first two posts of this blog series, we heard why two students chose to pursue a STEM field and what appealed to them about data science. We also heard how they put their knowledge to work on a real-world data science project. Today, we'll hear their advice to future


最近、SNSなどで「AI開発ミステリー ~そして誰も作らなかった~」という記事が話題になりました。人工知能(AI)を導入しようという企業の最悪の顛末をコミカルに描いたジョーク・ストーリーですが、これを面白がる人が多いというのは、多少なりとも日本のIT業界の現実を反映しているのかもしれません。 このような事態になっているのは、AIに対する過度な期待が原因の一つかもしれません。AIは、機械に任せれば素晴らしいことが起こる魔法ではなく、明確に定義されたタスクを実行するように機械をトレーニングする方法です。人間が行うタスクを機械が代替することになるのですが、人間が活動しているシステムのなかで、どの部分を機械にやらせるかを考え、実装し、運用しなければなりません。これは、これまでSASが実現してきたアナリティクスの延長にほかなりません。 「AIが発達すればデータサイエンティストはいらない」という説もあります。データサイエンティストが機械学習を実装する役割だけを持つのであれば、そうかもしれません。しかし、本当に必要とされる仕事が「人間が活動するシステムの中でのアナリティクスの活用」であるなら、まさにAIが使われる仕組みを考え、実装し、運用できる状態にする人材こそが求められているのではないでしょうか。 今年5月、SAS Forum Japan のなかで開催された「データサイエンティスト・キャリア・トラック」では、アナリティクスを活用する組織のなかでデータサイエンティストがどのように活躍するかについて、企業の方々から学生向けの講演をいただきました。例えば、ITや数理モデルを使いこなせることは初級レベルで、ビジネススキルを身に着けながら、最終的には経営幹部候補となるキャリアパスを提示している組織や、一方で、趣味で培ったスキルをビジネスに生かすデータサイエンティストがいます。このように、データサイエンティストのキャリアは組織・個人によってさまざまですので、多様人材がそれぞれの強みをもって活躍することができそうです。 しかし、どの組織・個人でも共通しているのは「目的志向」である点です。何のためにデータ分析をするのか、それがどのような価値を持つのかを明確にしなければ、課題解決のためのデータ分析はできません。データサイエンティストは単にデータ分析の技術で課題解決するだけでなく、「課題設定」をする役割を持たなければ本当の価値は生み出せないのです。そもためには、さまざまな問題意識を抱える人たちと異業種交流をするなど、幅広い視野が必要となりそうです。 データサイエンティスト協会が示した3つのスキルのうち、「ビジネススキル」については、ときどき「ドメイン知識」(業界や業務についての知識)として紹介されることがあります。しかし、本当に必要なのは、その知識を解決すべき課題に変換する力だと考えます。データサイエンティストを目指す学生が、すべての業界・業務についての知識を得ることは難しいですが、アナリティクスが活用される代表的な業界において、どんな課題がどのようにアナリティクスにより解決されているかを知ることで、応用力を身に着けられるのではないでしょうか。そこで、SAS Japanでは、次のような内容の学生向けセミナー「データサイエンティストのキャリアと活躍のかたち」をシリーズで開催します。 データサイエンティストのキャリア ... 「データサイエンティスト・キャリア・トラック」の講師陣による、それぞれの組織や個人としてのデータサイエンティストのキャリアや活躍のかたちを紹介 ビジネスで活用されるアナリティクス ... データサイエンスやアナリティクスがどのような業界のどんな課題を解決するために活用されているかをSAS社員が紹介 学生によるデータサイエンスの学び ... 学生がどのようにデータサイエンスを学習しているかを学生自身による体験を交えながら紹介 第1回は11月30日(金)に開催します。データサイエンティストを目指す学生の皆様のご参加をお待ちしています。
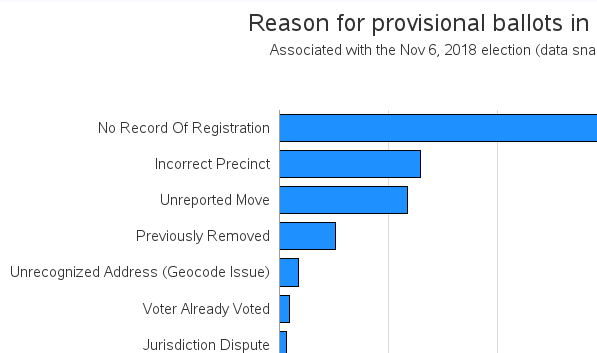

There has been a lot of controversy surrounding this year's midterm election, when it comes to counting the ballots ... and I kept hearing the term provisional ballots in the news. But I'm embarrassed to say that I didn't really know much about provisional ballots. I decided to do a

When describing their business model, our customer, Epipoli (one of the leading gift card companies in Europe), tells the story of the ancient Limoncello makers of Italy. Limoncello is an intensely lemon-flavored liqueur famously produced in Sorrento, the Amalfi coast, and the island of Capri. The drink started as a local tradition, but quickly


Se promueve como el fin de semana más esperado, creado para reactivar la economía de México: el Buen Fin, que en su versión 2018 se celebra del 16 al 19 de noviembre. De acuerdo con la Secretaría de Economía (SE), se prevé que la derrama económica de este año supere
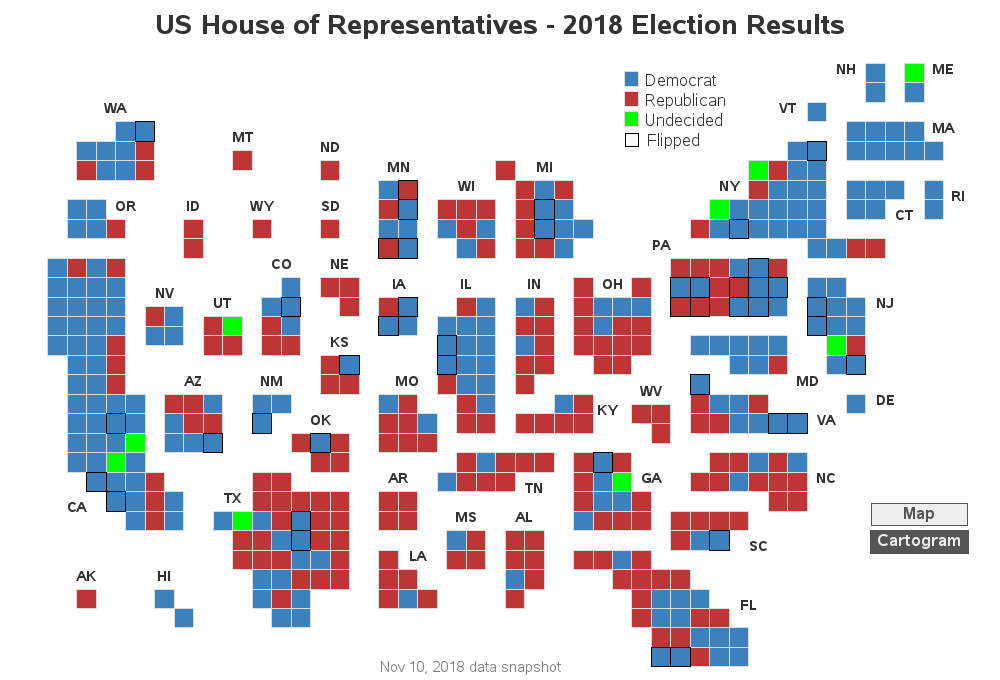
The US 'midterm' elections have finally started to wind down, and we finally have some (mostly) finalized results to study. But what's the best way to visualize who won the US congressional seats in each of the 435 districts? Let's dive into this topic!... Preparation For starters, I couldn't find
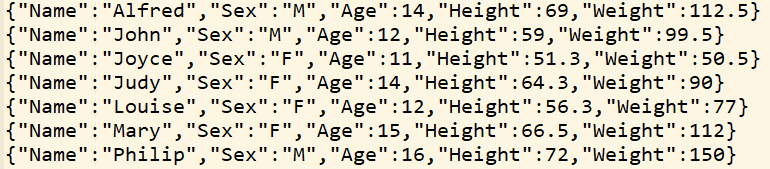

JSON is a popular format for data exchange between APIs and some modern databases. It's also used as a way to archive audit logs in many systems. Because JSON can represent hierarchical relationships of data fields, many people consider it to be superior to the CSV format -- although it's

Joseph Woodside shares examples of applied experimental learning in healthcare from his book, "Applied Health Analytics and Informatics Using SAS".


Prior to distributed DATA Step, DATA Step programmers never had to think about achieving repeatable results because DATA Step ran single-threaded and the source SAS7BDAT dataset was stored on disk. But if you need to obtain repeatable results in DATA Step code that runs distributed in CAS, this post provides a workaround that you'll want to keep handy.
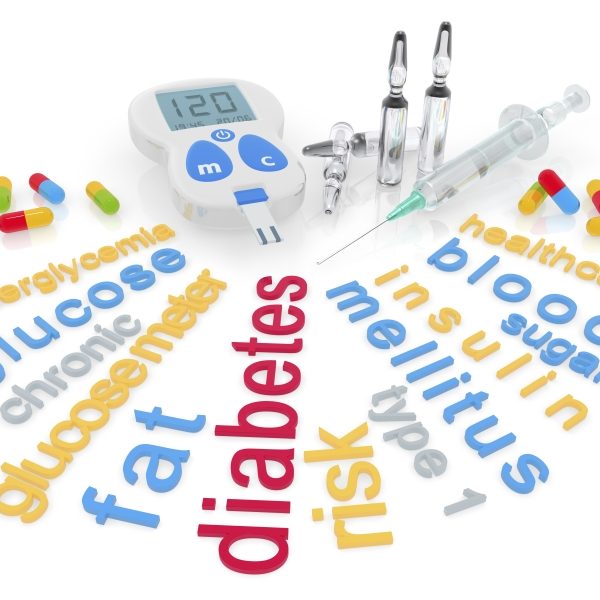

Teenagers. I have three boys, and two of them are teenagers. 15 year-old Kav is my middle son, and he gave me permission to share his story here. When he was five, Kav was diagnosed with Type I Diabetes, and I'm in awe of how he's accepted this challenging, lifelong


We all know that vegetables are good for us and there are literally thousands of studies over decades of research that tell us this. And many of us know that we don’t eat enough of them. Full of antioxidants, phytochemicals, vitamins, minerals and fiber- things your body NEEDS!- vegetables are
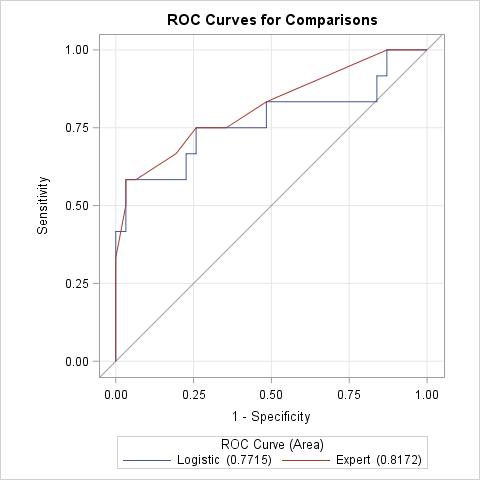

An ROC curve graphically summarizes the tradeoff between true positives and true negatives for a rule or model that predicts a binary response variable. An ROC curve is a parametric curve that is constructed by varying the cutpoint value at which estimated probabilities are considered to predict the binary event.
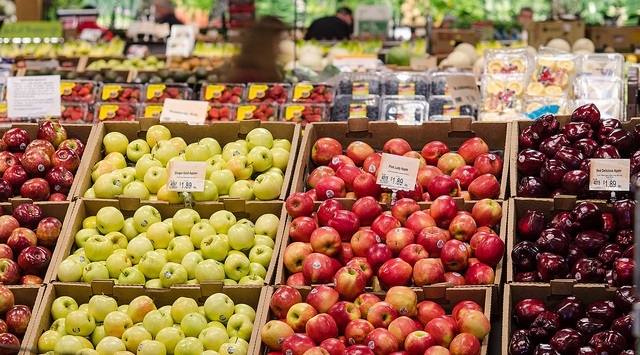

In many grocery stores throughout the country, the acronym “WIC” accompanies a number of the food items on the shelves. The letters stand for the federal “Women, Infants and Children” program that provides nutritional food to pregnant women and their young children who are in need. While this is a


SAS is launching the SAS Student Series, which bundles thousands of dollars’ worth of training and certification materials into an affordable package for university students and recent graduates.