All Posts


Recently I was asked to explain the result of an ANOVA analysis that I posted to a statistical discussion forum. My program included some simulated data for an ANOVA model and a call to the GLM procedure to estimate the parameters. I was asked why the parameter estimates from PROC
Recently I was asked to explain the result of an ANOVA analysis that I posted to a statistical discussion forum. My program included some simulated data for an ANOVA model and a call to the GLM procedure to estimate the parameters. I was asked why the parameter estimates from PROC


You’re probably already familiar with Leonid Batkhan from his popular blog right here on The Learning Post. In fact, he’s one of our most engaging authors, with thousands of views and hundreds of comments. Leonid is a true SAS Sensei. He has been at SAS for nearly 25 years and


Los sistemas de transporte son, sin duda, un importante factor para el crecimiento económico de un país. Cuanto más eficientes, ágiles, puntuales y seguros sean, mayor será su impacto en la movilidad de la población y las distintas actividades productivas. Las opciones son muy variadas: autobuses, microbuses, taxis, trenes, metro,


You run the same route every day, a flat track. You run the same distance in the same amount of time. You know the route which means you don’t have to pay much attention. One day you arrive to find the shape of the track has changed and the terrain


You'll notice several changes in SAS Grid Manager with the release of SAS 9.4M6. This post gives a brief architectural description of the new SAS grid provider, including all major components and their role.


The first person to live to 150 has already been born. When I first heard this controversial idea, popularized by biomedical gerontologist Aubrey de Grey of the SENS Research Foundation, it gave me chills. It’s amazing to think we could have 50 more years to spend with loved ones and
In machine learning and other model building techniques, it is common to partition a large data set into three segments: training, validation, and testing. Training data is used to fit each model. Validation data is a random sample that is used for model selection. These data are used to select
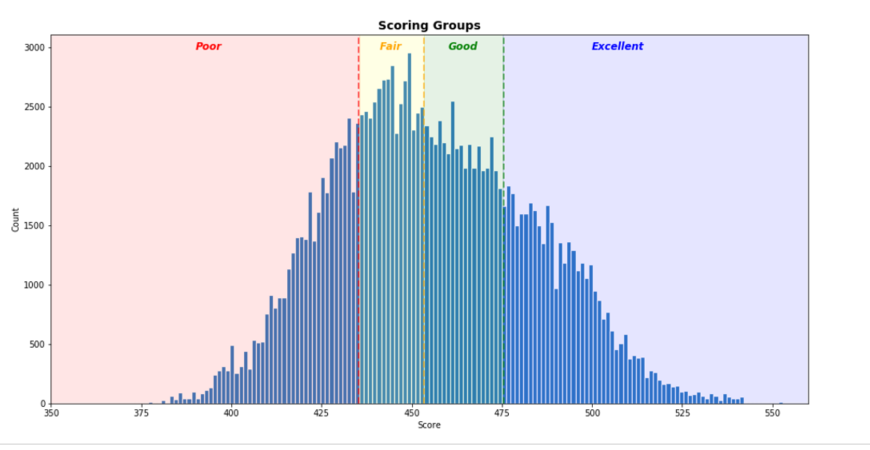

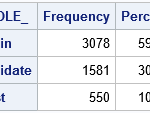
Whether you’re applying for your first credit card or shopping for a second home – or anywhere in between – you’ll probably encounter an application process. As part of that process, banks and other lenders use a scorecard to determine your likelihood to pay off that loan. Naturally, this means


私が小学生のころ、21世紀になると自動車は空を飛び、真空チューブの中のリニアモーターカーは時速2000kmに達するものだと思っていましたが、現在のような情報化社会は想像できていませんでした。初めてパソコンに触ったとき、何をするためのものなのかさっぱりわからなかったことを覚えています。 いまの小学生が大人になるころは、どのような社会になっているのでしょうか。10年先、20年先を想像することは難しいですが、子どもたちは、その社会で生きるための力を身につける必要があります。


Learn about the latest product features, changes and upgrade information in new sections of SAS product documentation for SAS® 9.4 and SAS® Viya®. SAS' Kathryn McLawhorn tells us all about them.
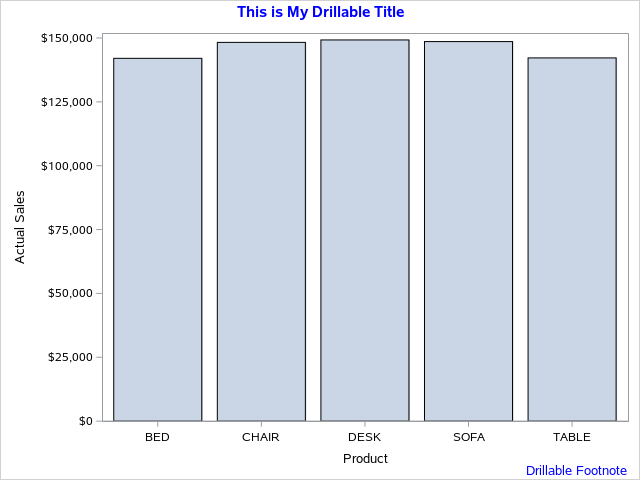

Tool tip and drill-down functionality is commonly used to explore plot data in a graph, particularly on the web. Occasionally, you might even have the need to add this drill-down functionality to your titles or footnotes, possibly to reference more details or source information. The TITLE and FOOTNOTE statements in
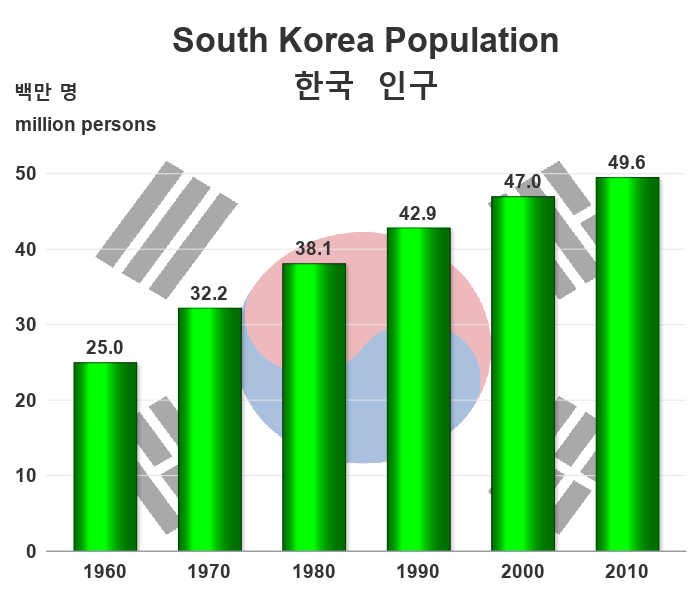

They say "The Sun never sets on the SAS Empire" ... and it's true! There are SAS users all over the world, and SAS output & results could be in any language. Therefore, if you're a SAS programmer, you might need to know how to create SAS graphs with international


SAS supports direct integration for Git from Base SAS (via functions), SAS Enterprise Guide, SAS Studio, and SAS Data Integration Studio. Read this article to learn how to use Git more effectively in your SAS processes.


Guest blogger Khari Villela says data lakes are not a cure-all – they're just one part of a comprehensive, strategic architecture.