Tool tip and drill-down functionality is commonly used to explore plot data in a graph, particularly on the web. Occasionally, you might even have the need to add this drill-down functionality to your titles or footnotes, possibly to reference more details or source information. The TITLE and FOOTNOTE statements in SAS have a LINK option that can be used to add these links to the text for SAS/GRAPH, but this option is not currently supported for ODS Graphics. However, you can create these drillable titles and footnotes by using just a little SG annotation.
data linked_tf; length function $ 8 url $ 21 anchor $ 5; function="text"; label="This is My Drillable Title"; url="http://www.sas.com"; textstyleelement="GraphTitleText"; textcolor="blue"; width=100; anchor="top"; y1=100; drawspace="GraphPercent"; output; label="Drillable Footnote"; url="http://www.google.com"; textstyleelement="GraphFootnoteText"; anchor="right"; x1=98; y1=2; output; run; ods _all_ close; ods html path="." (url=none) file="drillable.html"; ods graphics / imagemap imagename="DrillableTF"; proc sgplot data=sashelp.prdsale sganno=linked_tf pad=(top=30px bottom=10px); vbar product / response=actual; run; ods html close; |
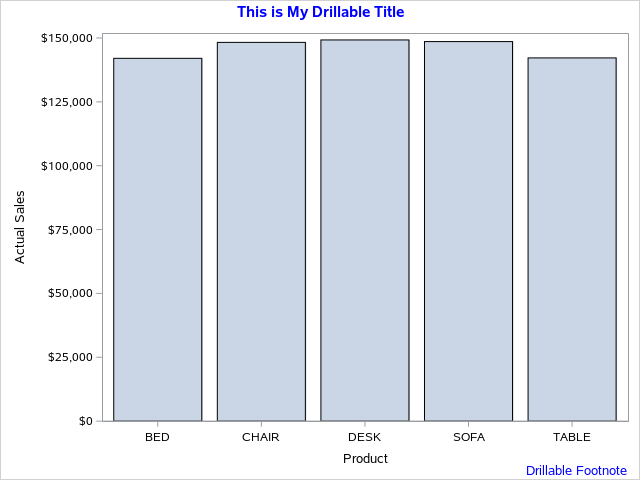
This example creates an SG annotation data set containing two TEXT annotation records -- one for the title and one for the footnote. I used the TEXTSTYLEELEMENT column as a simple way to ensure that the title and footnote text looks like titles and footnotes for the active ODS style; however, I did override the TEXTCOLOR to be blue to make it look like a drillable link. I set the DRAWSPACE for the annotation to be GRAPHPERCENT, which means that the X1 and Y1 values should be interpreted as percentage values relative to the entire graph area (as opposed to the layout or wall areas). I set the WIDTH of the text box to 100 percent to prevent any wrapping of the text, and I set the ANCHOR point for the text box in different locations to make it easier to position the text.
Once the data is created, there are a couple of other important items to remember. First of all, be sure to set the IMAGEMAP option on the ODS GRAPHICS statement. You can have everything else coded correctly; but if you do not set that option, you will not get any drillable text (or tool tips, for that matter). Second of all, annotations do not reserve space in the graph, unlike titles and footnotes. Therefore, you need to tell the graph to make space for the text; otherwise, the text could overwrite part of your graph. On the PROC SGPLOT statement, I used the PAD option to add space to the TOP and BOTTOM of the graph.
This technique can be used on the SGPLOT, SGPANEL, and SGSCATTER procedures, as well as in the Graph Template Language (GTL). For GTL, it is also possible to use the DRAWTEXT statement to add drillable text directly in your template; however, using DRAWTEXT in the template code could impact the re-usability of your graph template. Consider your needs before using that approach.


4 Comments
Can GTL also use this ?
Yes! You can use the SG annotation data in GTL by putting the ANNOTATE statement in your GTL template, and specifying the SGANNO option on PROC SGRENDER. See my paper on GTL annotation for more examples (https://support.sas.com/resources/papers/proceedings16/SAS5300-2016.pdf)
Though the LINK option for TITLE and FOOTNOTE statements is not currently supported the same way in ODS Graphics as it is supported in SAS/GRAPH, it IS possible to use it with those statements by using NOGTITLE and NOGFOOTNOTE on the ODS HTML statement. (For SAS/GRAPH you can, and I prefer to, use GTITLE and GFOOTNOTE instead.) I have been using the LINK options since its inception several years ago (and a workaround before that). Besides your example and mine below (to link between graph and table forward and back), it is a particularly handy solution to support toggling between different graphic views of the data. (Such a title link can also be imbedded in a spreadsheet created with ODS EXCEL.) Here is my code:
let path = c:\temp\GraphAndTable;
ods results off; /* don't open output in the SAS session */
ods _all_ close;
ods html path="&Path" (url=none)
file="BarChart.html"
(title="Bar Chart of Total Sales By Product") /* optional */
nogtitle nogfootnote;
title1 h=3 "Total Sales By Product";
title2 h=3
link="Table.html"
"Go To Table of the Detail Data";
footnote;
ods graphics / imagename="BarChart";
proc sgplot data=sashelp.prdsale;
vbar product / response=actual;
run;
ods html close;
ods html path="&Path" (url=none)
file="Table.html"
(title="Web Table of Product Sales Detail") /* optional */
;
title1 h=3 "Product Sales Detail";
title2 h=3
link="BarChart.html"
"Go To Bar Chart of Total Sales By Product";
footnote;
proc print data=sashelp.prdsale noobs;
id product;
run;
ods html close;
Great points, Dr. Bessler. Thanks for your feedback!