All Posts
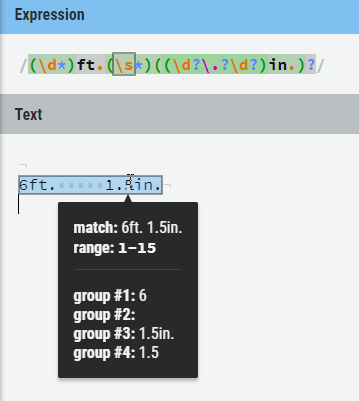

Regular expressions are a powerful method for finding specific patterns in text. The syntax of regular expressions is intimidating, but once you've solved a few pattern-recognition problems with regex, you'll never go back to your old methods.
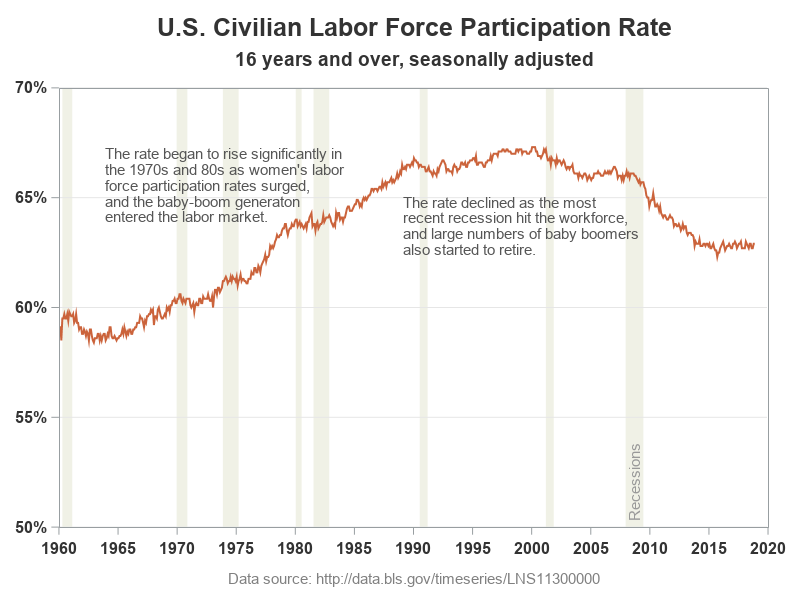

Plotting just your data often helps you gain insight into how it has changed over time. But what if you want to know why it changed? Although correlation does not always imply causation, it is often useful to graph multiple things together, that might logically be related. For example, recessions
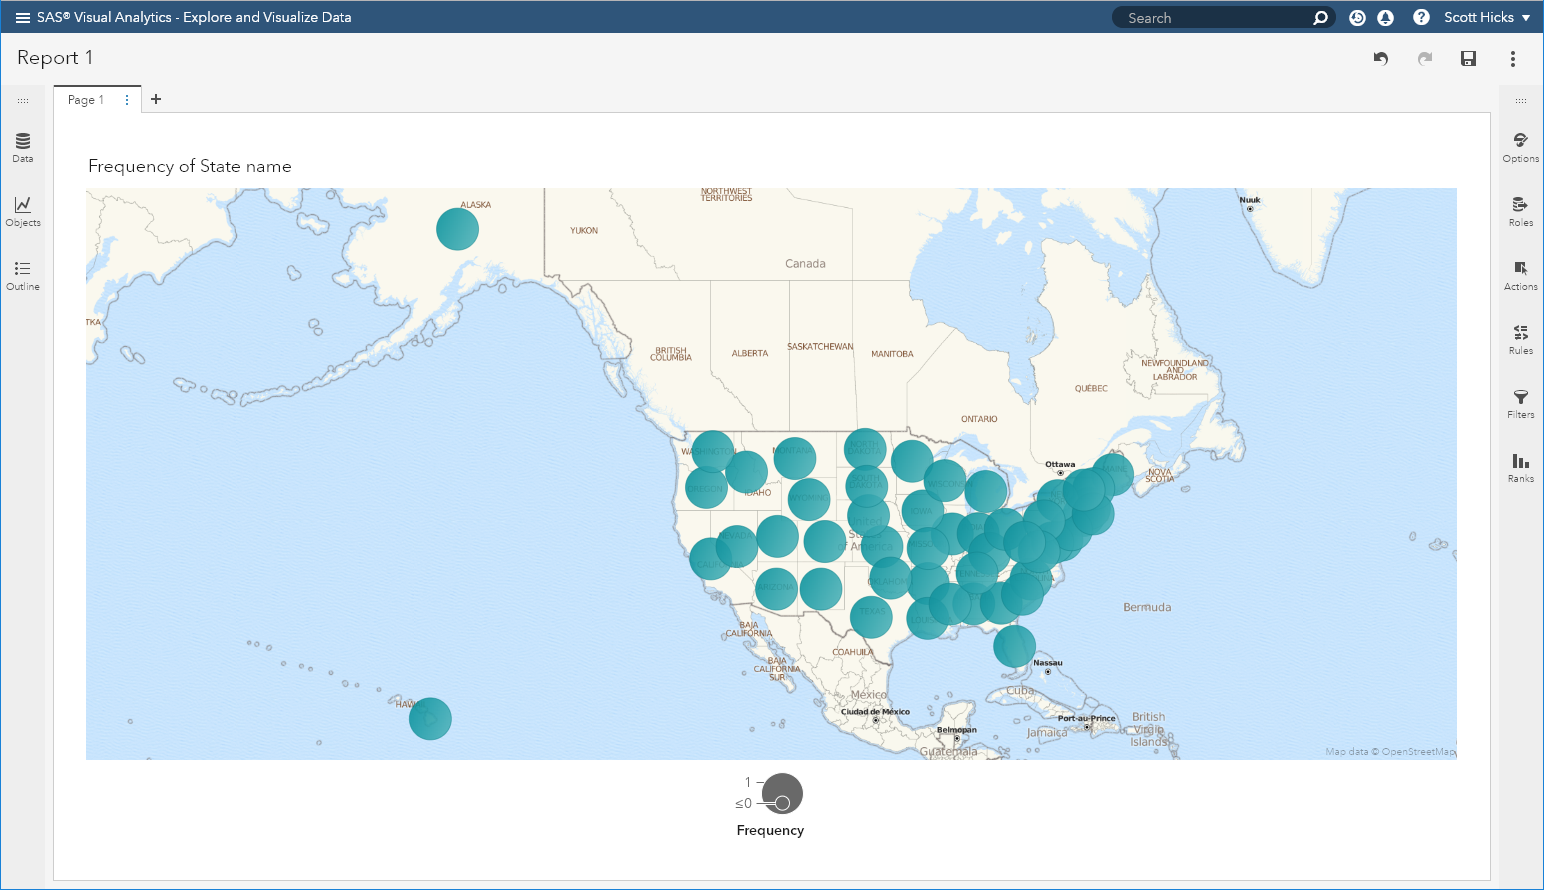

Creating a map with SAS Visual Analytics begins with the geographic variable. This blog post explains the first type of geography variable that VA supports: predefined. Future posts will cover the other two types of geography variables in VA: custom coordinates and custom polygons.
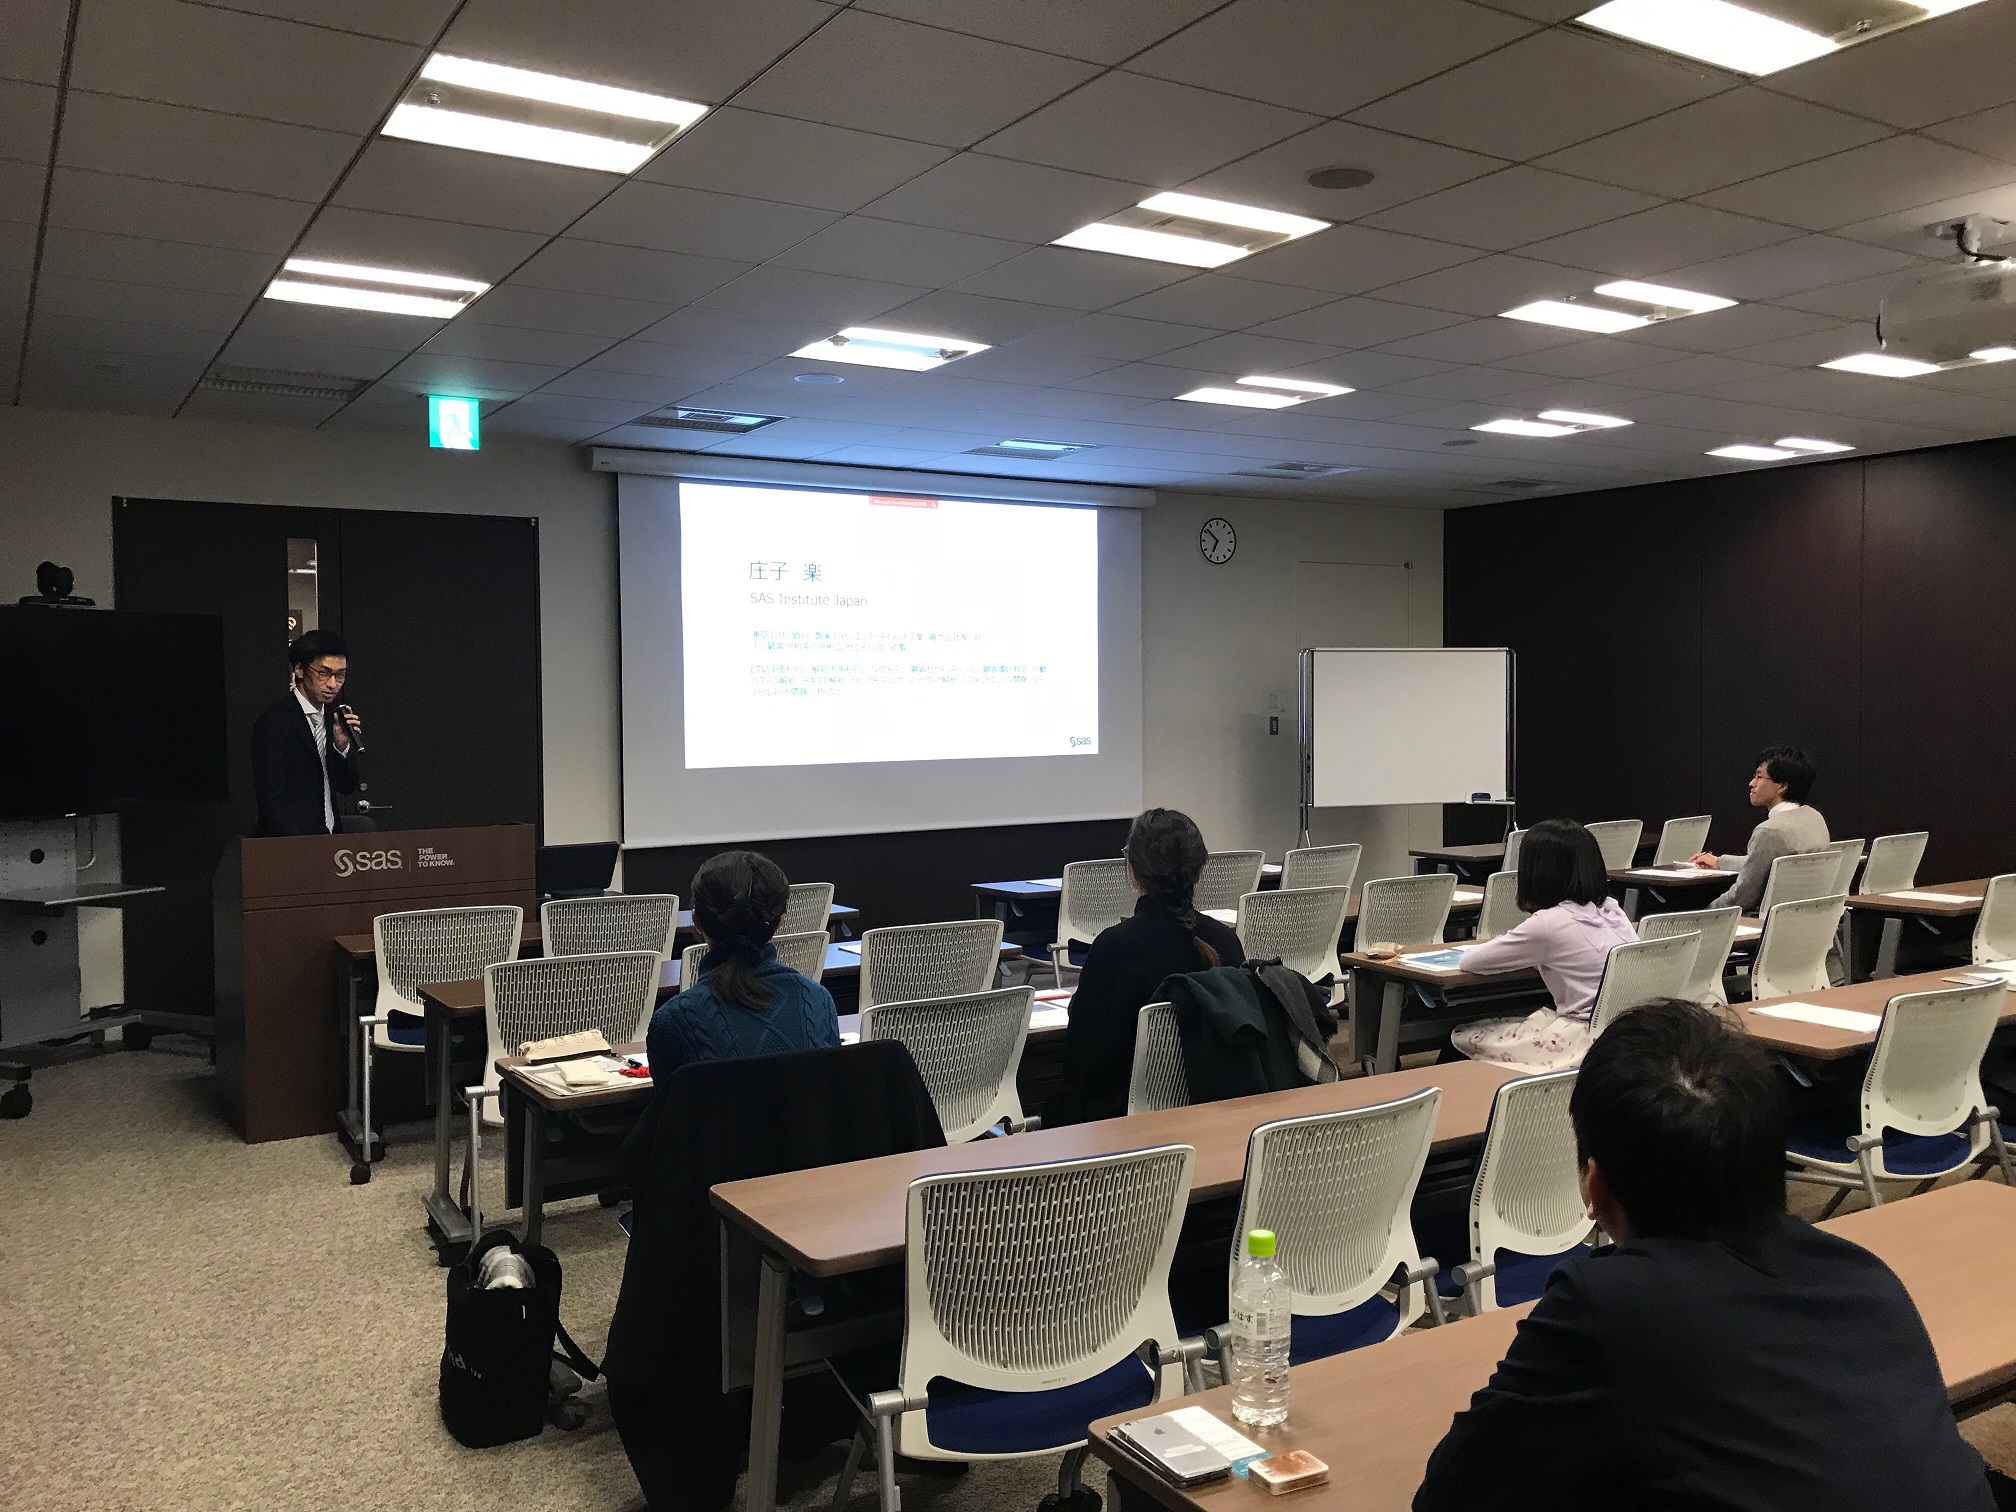

第1回に引き続き、データサイエンティストを目指す学生向けのセミナー「データサイエンティストのキャリアと活躍のかたち」の第2回が1/31(木)に開催されました。当日の様子について紹介します。 このセミナーはデータサイエンティストのキャリアと活躍の場や、ビジネスではアナリティクスがどのように活用されているかについて、スピーカーがこれまでの経験をもとに紹介するものです。 経営幹部候補としてのデータサイエンティスト はじめに、データサイエンティストのキャリアについて、コニカミノルタジャパン株式会社・松木さんの講演です。コニカミノルタジャパンでは、2016年にデータサイエンス推進室を設置し、コピー機の買替・故障・受注の予測などにデータ分析を活用しているそうです。 まず、成果を出せるデータサイエンティストのキャリア形成についての話です。この話題の中では「データサイエンティストとは経営幹部候補、すなわち分析・数理モデルで経営課題を解決できる人材である」という一文がとても印象的でした。松木さんは、ただ分析作業ができる・数理モデルを作成できるだけではなく、それらの優れた技術をツールとして経営課題の解決ができる人材というのがデータサイエンティストのあるべき姿と考えると言っていました。 次に、データサイエンティストに求められるスキルについてです。そのスキルとは主に、分析スキル・ITスキル・ビジネススキルに分けられますが、その中でもビジネススキルは他の2つに比べて教育が困難であり、知識と経験が必要です。そこで実際にコニカミノルタジャパンでは、分析・ITスキルをもつデータサイエンティストと、ビジネススキルを持つ他部署メンバーとが共同して分析を行う仕組み(=タスクフォースユニット)でデータサイエンティストのビジネススキルを補うことを行っているそうです。 こうして、組織単位で分析を進めるにあたって欠かせないのがコミュニケーション能力です。ここで言うコミュニケーション能力とは、単純に人と仲良くなれるという意味よりも、「相手を理解するための、幅広い知識を習得する」「相手が理解できるようにデータサイエンスの見える化をする」ことを指します。現場や他部署メンバーの考えを理解するためのビジネスにおける幅広い知識、データサイエンスの知見がない人でも一目でわかる環境の構築が必要であるとのことでした。 講演の最後には、「データサイエンティストは多種多様な専門性が必要である」というメッセージをいただきました。これまでの話にもあったように、数理モデルの開発といった場面は仕事の一部で、ビジネススキルやコミュニケーション能力を活用することでいかに他の社員に、現場に「みせる」かが重要であるということを学生に伝えていただきました。 ビジネスで活用されるアナリティクス “顧客理解” 次に、ビジネスで活用されるアナリティクスについて、SAS Japanの庄子による講演です。 「通信販売サイトから自分だけのクーポンが送られてきた」、「動画配信サービスに自分好みの動画がおすすめされる」、「携帯電話の学割があれほどまで安い」などといった例を挙げ、私たちが日常生活においてデータ分析の恩恵をどれだけ受けていると思うか?という質問を導入として講義は始まりました。また、消費者のうち64%は支払う金額よりもそのもの自体の質を重視するにもかかわらず、それを完璧に捉えることが出来ている企業はわずか6%であるという話もあり、顧客理解の重要性を直観的に感じることが出来ました。 顧客理解について、前半ではそのコンセプトの紹介です。 顧客理解とは何を理解するのか?代表的な3つの項目があります。 「顧客の優良度・リスク」:どの顧客が特に大事か、損をもたらす可能性が高いか 「顧客の嗜好」:個々に異なる顧客の好みに対して何を薦めるべきか 「顧客の行動」:顧客の生活パターンや生活圏等を考慮する この3項目について、携帯キャリアの顧客理解に関する施策を顧客の加入から解約の流れに沿って例示していました。 後半は具体的に3つの項目についてどのような分析を行っているかについて、前半にもあった携帯キャリアの顧客理解に関連する具体的な施策に3項目をそれぞれ当てはめて紹介していました。ここではその一部を簡潔に紹介します。 「顧客の優良度」:生涯価値(Life Time Value)の算出(どれくらい先まで契約の継続をしそうか、機種変更はいつ頃しそうか) 「顧客の嗜好」:テキストを用いた趣味嗜好判定 「顧客の行動」:位置情報による生活圏の特定 最後には、「企業のデータ活用はまだまだ発展途上でみなさんの活躍が企業や世の中を大きく変える」という前向きなメッセージと、情報倫理のプライバシー懸念について「倫理観が大事”Don’t Be Evil”(by Google)」という助言の両方を学生に向けたメッセージとして伝えていました。 SAS student Data for Good communityの紹介 セミナーの最後には、学生のデータサイエンティストに向けた学びとしてSAS student Data for Good communityについて紹介しました。 「Data for Good」とは多岐にわたる社会的なテーマから課題を提示し、データを活用して解決しようとするものです。これまでにブログで紹介した世界の絶滅危惧種や通勤ラッシュ時の鉄道混雑緩和をData

Hablar de Inteligencia Artificial parece muy lejano para algunas personas y para otras es algo que ya se está implementado a una gran velocidad. En este artículo espero iniciar con una serie de reflexiones y conversaciones acerca de lo que esperamos desarrollar hoy y a dónde queremos llegar en el
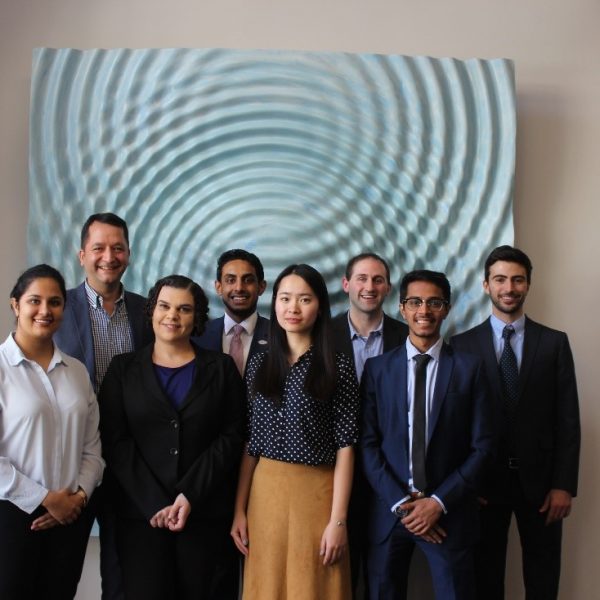

Each day, more than 130 Americans die from opioid overdoses. Combating the opioid epidemic begins with understanding it, and that begins with data. SAS recently partnered with graduate students from Carnegie Mellon University (CMU) 's Heinz College of Information Systems and Public Policy to understand how data mining and machine


Each week in February, your Work/Life team has invited therapists and dating professionals in the community to respond to questions about relationships. To kick off this series, we asked our experts… How do you keep from losing yourself in a relationship—new or longstanding? Kate Freiman-Fox, Ph.D. Matchmaking, Date and Relationship


February may be a short month, but it's packed: Groundhog Day, the Super Bowl, Valentine's Day...and the flu. Flu season is a lot like watching a sunrise. When flu season begins each Oct 1 there is a great sense of anticipation as the HCC administers thousands of flu shots and begins reporting flu and influenza-type illnesses to


Recently, I worked on a cybersecurity project that entailed processing a staggering number of raw text files about web traffic. Millions of rows had to be read and parsed to extract variable values. The problem was complicated by the varying records composition. Each external raw file was a collection of
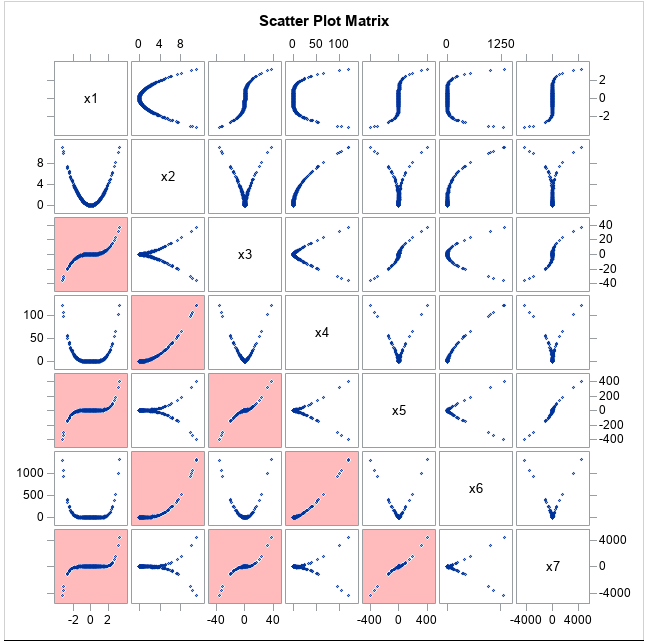

Feature generation (also known as feature creation) is the process of creating new features to use for training machine learning models. This article focuses on regression models. The new features (which statisticians call variables) are typically nonlinear transformations of existing variables or combinations of two or more existing variables. This


Talk to most parents about their role as parent, and you eventually hear the parent sigh and say, “I just want my kid to be happy,” or “A parent is only as happy as their least happy child.” There was a time in my life when I nodded in agreement,

SAS Press author Matt Windham shows you how to use the SAS procedure PROC HTTP to grab raw data from a website.
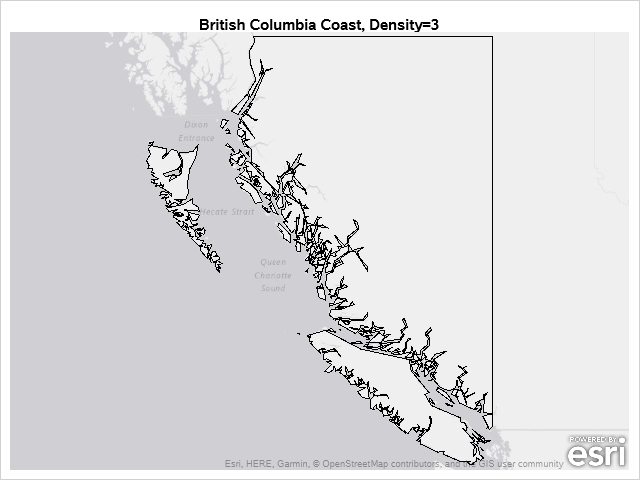

In the previous Graphically Speaking blog for PROC SGMAP, you used PROC GPROJECT so map regions would match OpenStreetMap and Esri background images. This time, the same British Columbia shapefile is used with: PROC GREMOVE to remove unwanted boundary lines PROC GREDUCE to reduce map data PROC GPROJECT to zoom
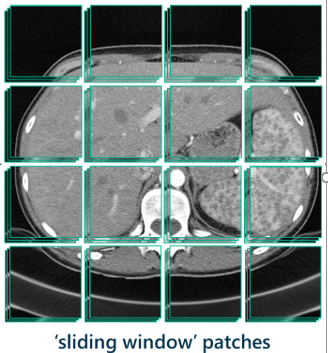

Recently, I was given an amazing opportunity to work on a project in biomedical image analytics in collaboration with a large university medical center. The goal of the project was to develop a computer vision system that identifies tumors in CT scans of livers. I have always loved applying technology

As a SAS analytical software tester, Portia Exum knows what it takes to deliver quality software. She understands the rigor and the dedication to produce a product that the world can trust. But last year, she was on the receiving end of what it means to trust and find confidence