This article is the first in a series of three posts to address REST APIs and their use in, and with, SAS. Today, I'll present a basic example using SAS Viya REST APIs to download an image from a report in SAS Visual Analytics.
The second article will show an example of the Cloud Analytics Services (CAS) REST APIs. My third planned article will outline a simple application that accesses SAS Viya using both sets of REST APIs.
You can read all of my posts on this topic here.
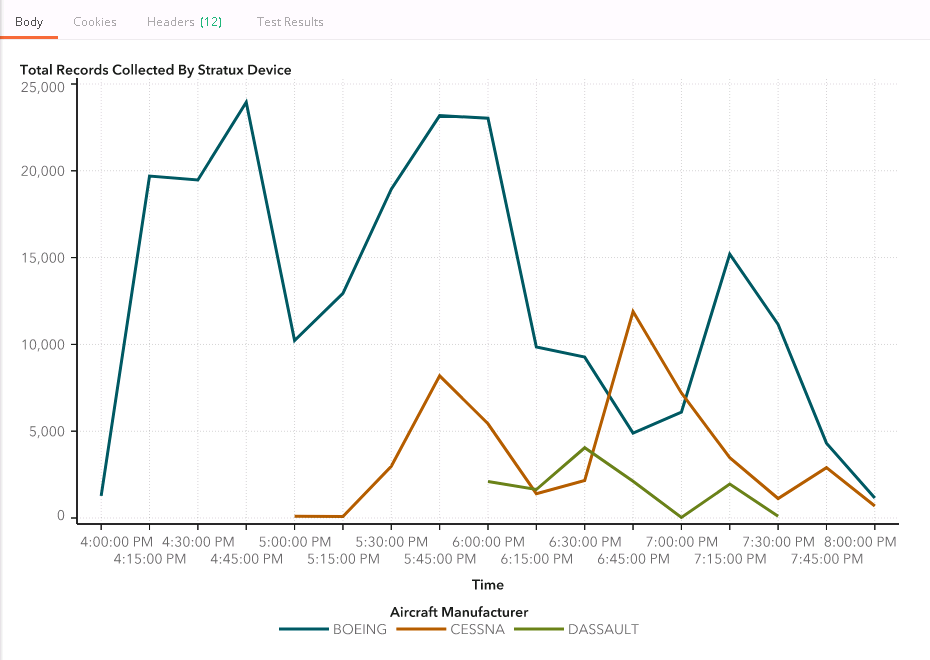
The inspiration for this example: a visualization of air traffic data
I ran across a great post from Mike Drutar: How to create animated line charts that "grow" in SAS Visual Analytics. I followed the steps in Mike's example, which creates a visualization of airline traffic. The result was an animated line chart. For this article, I removed the animation, as it will serve me better in my use case.
SAS Viya APIs and CAS APIs: Two entry points into SAS Viya
The first thing I'd like to cover is why SAS Viya offers two sets of REST APIs. Let's consider who is using the APIs, and what they are trying to accomplish? SAS Viya APIs target enterprise application developers (who may or may not be versed in analytics), who intend to build on the work of model builders and data scientists. These developers want to deliver apps based on SAS Viya technology -- for example, to call an analytical model to score data. On the other hand, the CAS REST API is used by data scientists and programmers (who are decidedly adept at analytics) and administrators, who need to interact with CAS directly and are knowledgeable about CAS actions. CAS actions are the building blocks of analytical work in SAS Viya.
How to get started with SAS Viya REST APIs
The best place to start working with SAS Viya REST APIs is on the SAS Developer's web site. There, you will find links to the API documentation.
The REST APIs are written to make it easy to integrate the capabilities of SAS Viya to help build applications or create scripts. The APIs are based on URLs, using HTTP Authentication, and HTTP verbs. The API documentation page is split into multiple categories. The following table outlines the breakdown:
| API Category | Description |
| Visualization | Provide access to reports and report images |
| Compute | Act on SAS compute and analytic servers, including Cloud Analytic Services (CAS) |
| Text Analytics | Provide analysis and categorization of text documents |
| Data Management | Enable data manipulation and data quality operations on data sources |
| Decision Management | Provide access to machine scoring and business rules |
| Core Services | Provide operations for shared resources such as files and folders |
The REST API documentation page is divided into multiple sections.
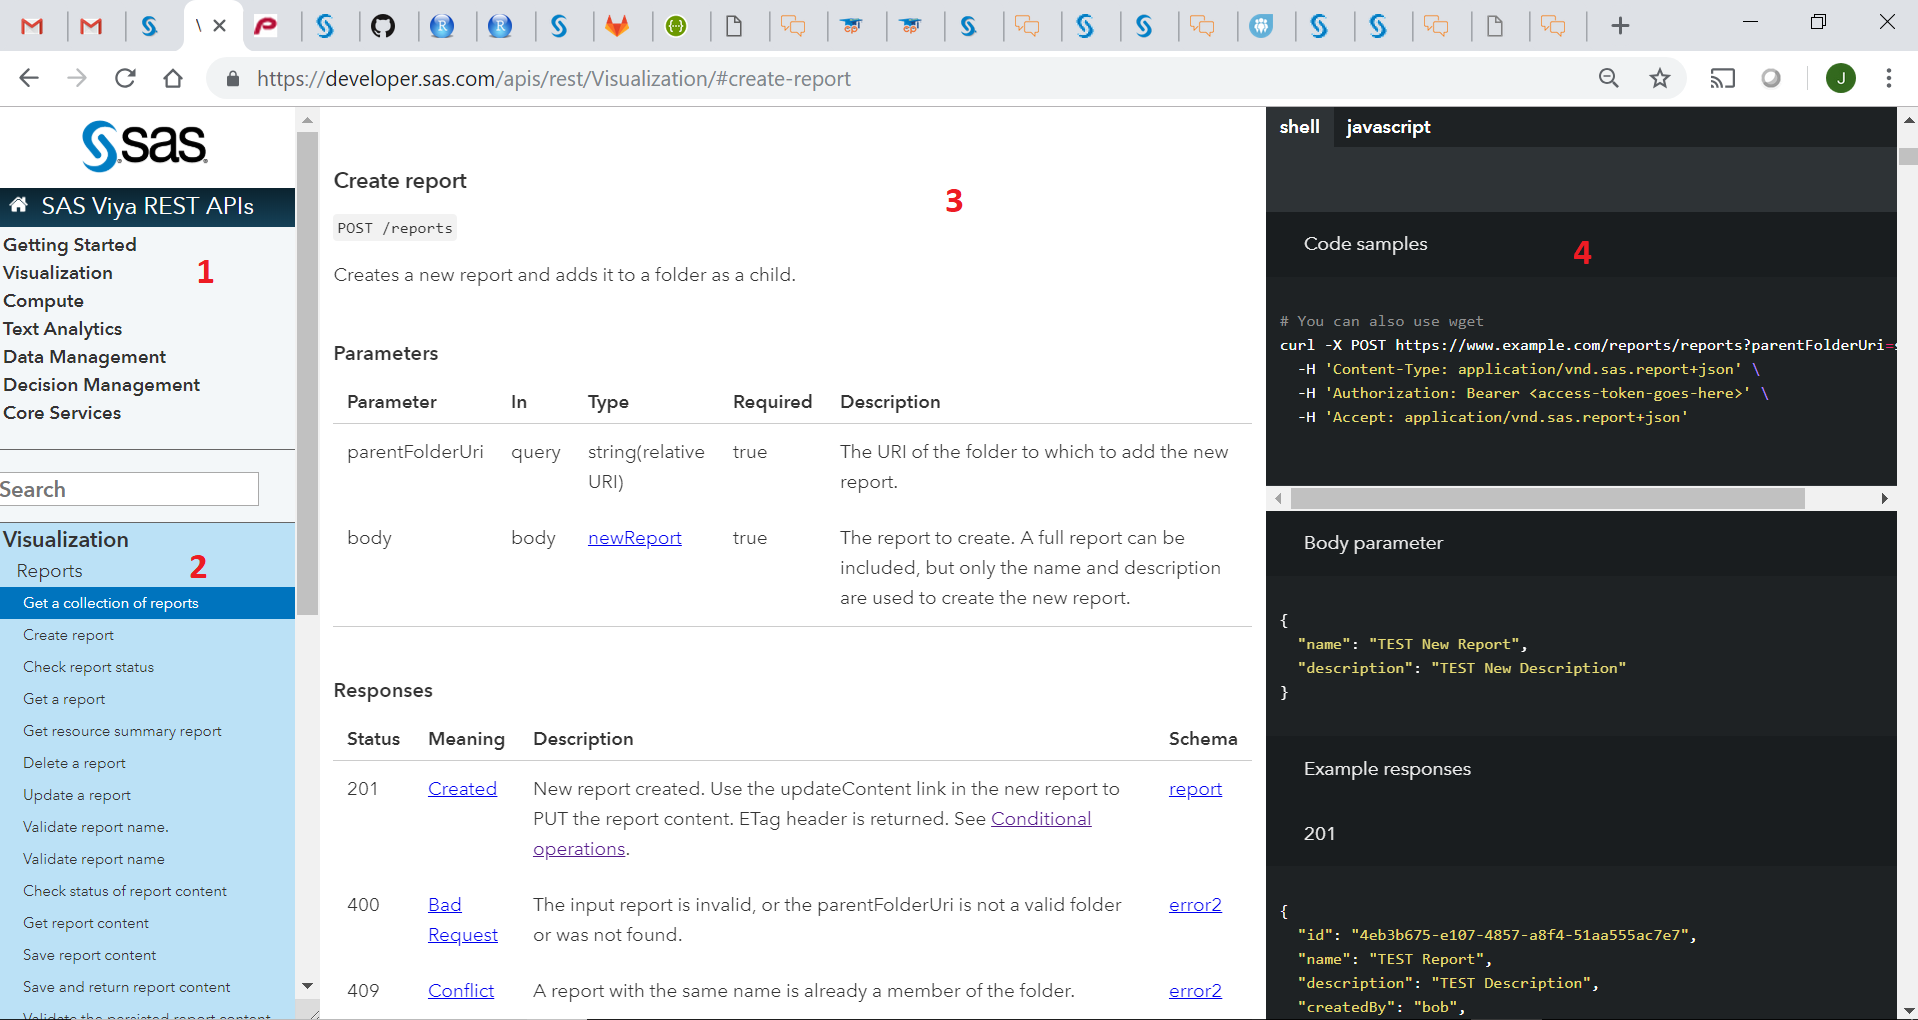
- The categories are listed in the upper-left side.
- Once a you select a category, related services and functions are listed in the lower left pane.
- The service appears in the center pane with a description, parameters, responses, and error codes.
- The right pane displays how to form a sample request, any optional or required body text, and sample response code.
The REST API call process
The example outlined in this article shows how to access a report image from SAS Visual Analytics. To try this out yourself, you will need: a SAS Viya environment (with SAS Visual Analytics configured), an access token, and a REST client. The REST client can be cURL (command line), Postman (a popular REST API environment), or Atom with the rest-client plugin -- or any other scripting language of your choice. Even if you do not have access to an environment right now, read on! As a SAS developer, you're going to want to be aware of these capabilities.
Get a list of reports from SAS Visual Analytics
Run the following curl command to get a list of reports on the SAS server:
curl -X GET http://sasserver.demo.sas.com/reports/reports \ -H 'Authorization: Bearer <access-token-goes-here>' \ -H 'Accept: application/vnd.sas.collection+json' |
Alternatively, use Postman to enter the command and parameters:

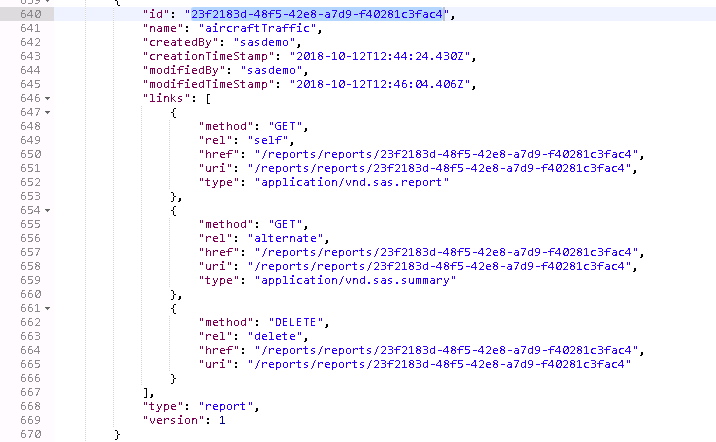
From the JSON response, find the report object and grab the id of the desired report:
Create a job
The next step is to create an asynchronous job to generate the SVG image from the report. I use the following HTTP POST with the /jobs verb:
curl -X POST http://sasserver.demo.sas.com/reportImages/jobs \ -H 'Authorization: Bearer <access-token-goes-here>' \ -H 'Accept: application/vnd.sas.report.images.job+json' \ -H 'Content-Type: application/vnd.sas.report.images.job.request+json' |
Using the following sample Body text
{ "version" : 1, "reportUri" : "/reports/reports/23f2183d-48f5-24e8-a7d9-f40281c3fac4", "layoutType" : "entireSection", "selectionType" : "report", "size" : "400x300", "refresh":true } |
Here is the sample response:
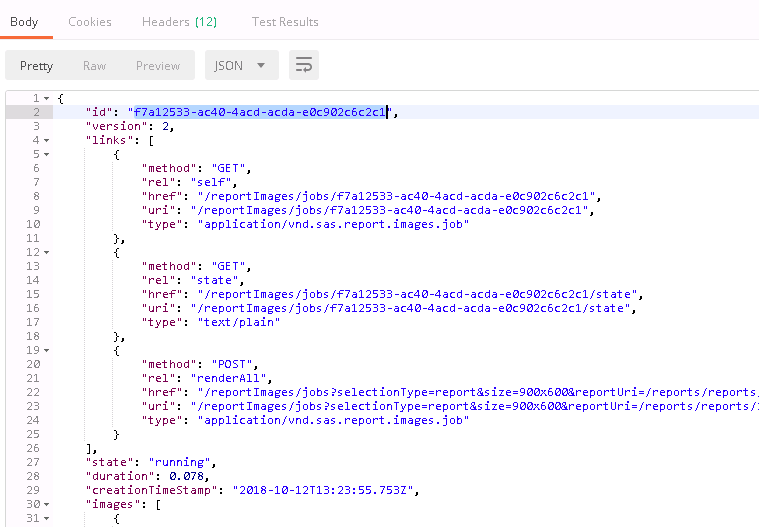
The job creation kicks off an asynchronous action. The response indicates whether the job is completed at response time, or whether it's still pending. As you can see from the above response, our job is still in a 'running' state. The next step is to poll the server for job completion.
Poll for job completion
Using the 'id' value from the job creation POST, the command to poll is:
curl -X GET http://sasserver.demo.sas.com/reportImages/jobs/f7a12533-ac40-4acd-acda-e0c902c6c2c1\ -H 'Authorization: Bearer <access-token-goes-here>' \ -H 'Accept: application/vnd.sas.report.images.job+json' |
And the response:
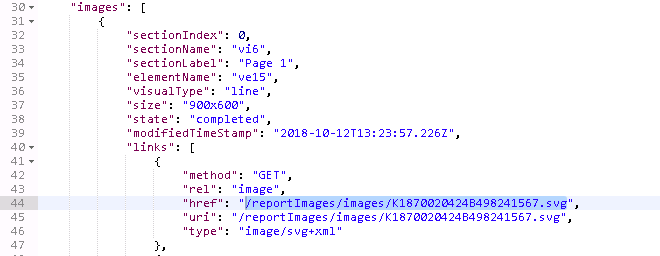
Once the job comes back with a 'completed' state, the response will contain the information we need to fetch the report image.
Get the image
I am now ready to get the image. Using the image file name (href field) from the response above, I run the following command:
curl -X GET http://sasserver.demo.sas.com/reportImages/images/K1870020424B498241567.svg\ -H 'Authorization: Bearer ' \ -H 'Accept: image/svg+xml' |
Postman automatically interprets the response as as an image. If you use the curl command, you'll need to redirect the output to a file.
What's Next?
SAS Visual Analytics is usually considered an interactive, point-and-click application. With these REST APIs we can automate parts of SAS Visual Analytics from a web application, a service, or a script. This opens tremendous opportunities for us to extend SAS Visual Analytics report content outside the bounds of the SAS Visual Analytics app.
I'll cover more in my next articles. In the meantime, check out the Visualization APIs documentation to see what's possible. Have questions? Post in the comments and I'll try to address in future posts.

14 Comments
John
Is there a REST API to create Alerts in Viya? I am having a lot of trouble finding documentation about doing it (if possible).
Hi Andrew,
SAS does not provide dedicated APIs for Alerts (that would be a big API :-). What I'd suggest is using job execution and creating the alerts with SAS code. This would allow you to set up pretty much any alert you want/need. I don't have an explicit example to link to, but this is a good opportunity for me to create a basic example and you can take it from there. I'll most likely add this in a SAS Community article and will link in this thread.
Hi Joe,
I replicated the process directly in Viya using the PROC HTTP method. I was able to get to the segment where the url is /reportImages/jobs/ portion of the code, but received this error when I executed the GET:
errorCode: 22023
message: Failure accessing (/reportRenderer/images), status code (500 INTERNAL_SERVER_ERROR)
What I'm looking to accomplish is to pull all the graph images out of the report/dashboard and save the images in a repository.
Hi Mike,
I'll be happy to take a look into this. I'll send a separate correspondence, so you can share the code and we can discuss in further detail. We'll make sure to post a summary here afterward.
Hi Joe,
Thanks for a very informative article. My company has a series of Viya dashboards that we are currently importing into Powerpoint and/or PDF using the SAS MS Office Add In. The process is very labor intensive and sometimes gets stuck if network traffic is high.
I'd like to export these reports using API calls. Ideally, we'd be able to use a pre-existing Powerpoint template, but I'll settle for just the export. Any input you might have would be welcome.
Hi Rick,
We have multiple report APIs that may satisfy your needs. I'd like to take a look at this use case with a couple of colleagues. If possible, could you post this same question in the Developers Community? You can reference this blog post. If you need assistance in starting the thread in the community, let me know and I can assist.
We can work on solving it there and dialogue will be much easier to handle. Once we come to a resolution, we can report back here with a link to the thread.
Thanks,
Joe
Done as suggested:
https://communities.sas.com/t5/Developers/Exporting-an-existing-dashboard-to-Powerpoint-and-or-PDF/m-p/700634#M1031
Thank you.
Thank you for a very informative article Joe.
Is it possible to get the report output as a pdf file instead of an svg image.
Hi Shri,
Thanks for reading and posting your question. As outlined in the API documentation, the only option is for the image to return in .svg format. You could take that image and convert it to a .pdf either with code or by hand, but that would be done outside of the REST call.
Thanks,
Joe
Hi Joe,
What happen if I want to put my VA report into my web application? How could I execute the GET request? According to the documentation, the Get Image response (https://developer.sas.com/apis/rest/Visualization/?python#get-image) is a JSON response, but it doesn't working when I call the report into my app, it's only works when I use Postman.
Thank you for your attention.
Hi Jose,
You may have unearthed an issue in the API doc, which we'll work on resolving.
Please change the print statement to
r.content()instead ofr.json().Thanks,
Joe
I used r.content and it worked.
thanks!
Hi Joe,
I have a doubt about "Create a job". When you were creating the job you sent as a POST request the follow Id into the body:
"reportUri" : "/reports/reports/b555ea27-f204-4d67-9c74-885311220d45",
Please, could you tell me where can I find my respectively reportUri to create a job?
Thank you very much for the content!
Hi Jose,
Thanks for reading the post and for your inquiry. I believe the confusion is that the report id in my screen shot of the response did not match the report id I used in the jobs call. I have fixed this issue and explain further below.
The report id comes from the call in the "Get a list of reports fro SAS Visual Analytics":
curl -X GET http://sasserver.demo.sas.com/reports/reports \
-H 'Authorization: Bearer ' \
-H 'Accept: application/vnd.sas.collection+json'
The response returns all reports. If you knew your report name in advance, you could add a filter to the request to return only that report. In my example I scrolled through the returned JSON, found the name of my report (aircraftTraffic)
"id": "23f2183d-48f5-24e8-a7d9-f40281c3fac4",
"name": "airTraffic",
and I use the corresponding id in the body of my jobs call (This is where I've now matched the ids in the screen shot and the code).
"reportUri" : "/reports/reports/23f2183d-48f5-24e8-a7d9-f40281c3fac4",I hope this clears things up. Please let me know if you have further questions.