All Posts


Appointrix optimiert die Wartezeit auf Handwerker mit Künstlicher Intelligenz. Er stellt sein Startup beim 3. MFG Gastspiel am 19. März bei SAS vor.
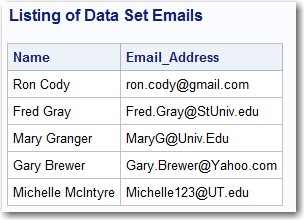

Did I trick you into seeing what this blog is about with its mysterious title? I am going to talk about how to use the FIND function to search text values. The FIND function searches for substrings in character values. For example, you might want to extract all email addresses


We all know that eating fruits and vegetables is good for us. This is a message we have heard since we were kids. The USDA recommends eating 5-9 servings of fruits and vegetables per day. However, nutrition experts and research suggest that more is better, typically agreeing that at least 8-10 servings


"Why are we doing this?" No matter who you are, that’s a question you’ve likely asked yourself more than once. Whether as a child receiving instruction from your parents, or as adults contemplating the reason behind decisions made at work, we are curious by nature. We all carry this innate


The introduction of analytics, machine learning and AI, will equip authorities to find previously undetected insight from their data.
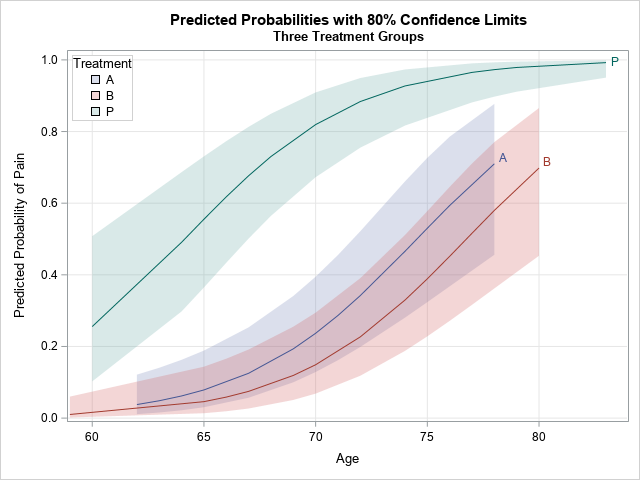

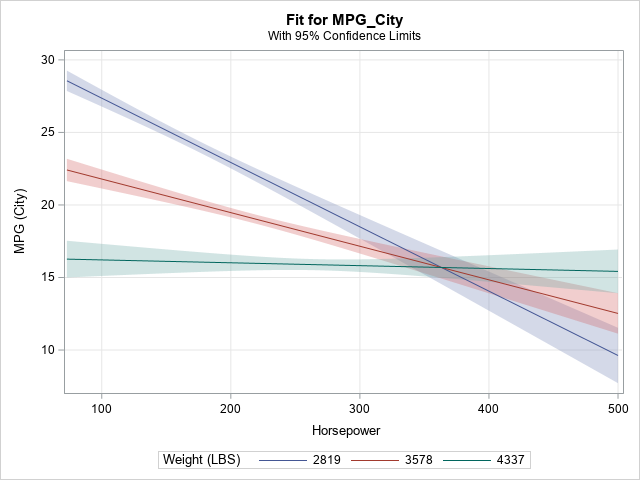
Many SAS procedures can automatically create a graph that overlays multiple prediction curves and their prediction limits. This graph (sometimes called a "fit plot" or a "sliced fit plot") is useful when you want to visualize a model in which a continuous response variable depends on one continuous explanatory variable
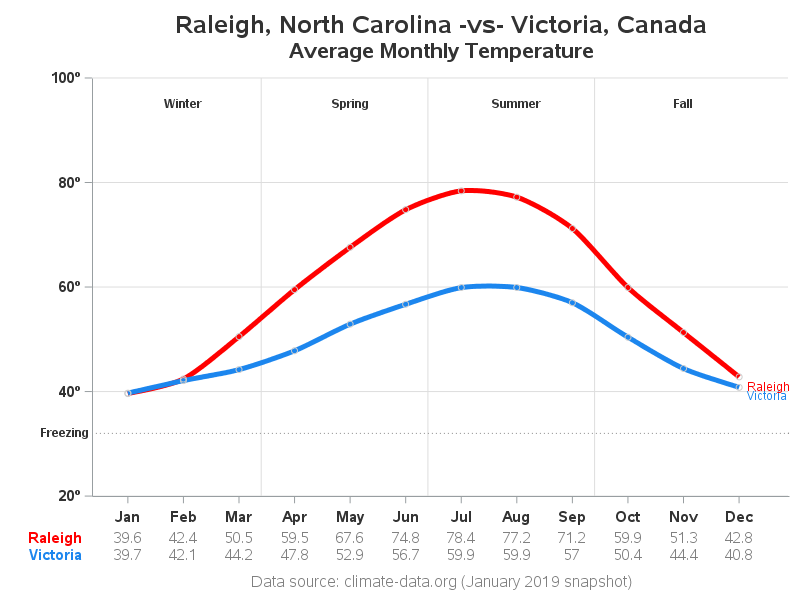

If someone proposes a bet to you, then you should be suspicious that they already know they're going to win. And one frequent topic of such bets is the weather... What if I bet you there's a city in Canada with a warmer average January temperature than Raleigh, NC? You


Behörden und Innovation: Was sich nicht gerade nach einer Traumpaarung anhört, hat in der Praxis reichlich Potenzial.


I have a 100-year-old father with dementia living with me and I also help parents of teens here at SAS. What do these two things have in common? The need to stay in relationship. Three years ago, I heard this simple statement and it hit me like a ton of


Toda industria tiene una alta demanda de recursos de Inteligencia Artificial (IA) – en especial, sistemas de respuesta a preguntas que se puedan utilizar para asistencia legal, búsquedas de pacientes, notificación de riesgo e investigación médica. Otros usos de la IA incluyen: Atención a la salud. Las aplicaciones de IA
Last year, I wrote more than 100 posts for The DO Loop blog. The most popular articles were about SAS programming tips for data analysis, statistical analysis, and data visualization. Here are the most popular articles from 2019 in each category. SAS programming tips Create training, testing, and validation data


A continuación, se mencionan algunos ejemplos: Comercio electrónico: La industria de comercio electrónico es probablemente una de las más dinámicas en términos de innovación tecnológica: cada vez que los usuarios interactúan con las aplicaciones y páginas web de las empresas, toda la información es continuamente capturada y representa la


It is a generally accepted maxim in business that you can’t cost-cut your way to success. Growth requires attention to the top line, which in turn is largely driven by innovation. Applying analytics to improving innovation suffers from the same lack of direction as does Analytics for strategy, but with
概要 第一回の「CASサーバーとSWATパッケージ」に続き、第二回としてCASのアクションセットの活用やCASサーバーへのデータ読み込みなどの基本操作の方法について紹介します。 アクションセットについて CASサーバー上での分析作業を開始する前に、“アクションセット”という重要な概念に関して紹介します。 アクションセットは、関連する機能を実行するアクションの論理的なグループです。 SAS Viyaでは、関数のことを「アクション」、関連する関数のグループを「アクションセット」と呼んでいます。アクションでは、サーバーのセットアップに関する情報を返したり、データをロードしたり、高度な分析を実行するなど、さまざまな処理を実行できます。 アクションセットを使ってみましょう それでは、サンプルコードを使いながら、SAS Viyaのアクションセットでデータの読み込みからプロットまでの一連の操作を説明します。 ・データの読み込み CASサーバーにデータを読み込むには二つの方法があります。一つはread.csv()でcsvファイルをRデータフレームの形で読み込んだ上で、as.casTable()を使用する方法です。この関数はデータをRのデータフレームからCASテーブルにアップロードすることができます。今回の例では金融関連のサンプルデータhmeqを使って紹介します。 library("swat") conn <- CAS(server, port, username, password, protocol = "http") hmeq_data <- read.csv(“hmeq.csv”) hmeq_cas <- as.casTable(conn, hmeq) もう一つはcas.read.csv()を使って、ローカルからファイルを読み込んで、そのままCASサーバーにアップロードする方法です。仕組みとしては、一つ目の方法と大きくは変わりません。 hmeq_cas <- cas.read.csv(conn, hmeq) as.casTable()或いはcas.read.csv()からの出力はCASTableオブジェクトです。その中に、接続情報、作成されたテーブルの名前、テーブルが作成されたcaslib(CASライブラリ)、およびその他の情報が含まれます。 Rのattributes()関数を使えば中身を確認できます。 attributes(hmeq_cas) $conn CAS(hostname=server, port=8777, username=user, session=ca2ed63c-0945-204b-b4f3-8f6e82b133c0, protocol=http) $tname [1] "IRIS" $caslib [1] "CASUSER(user)"
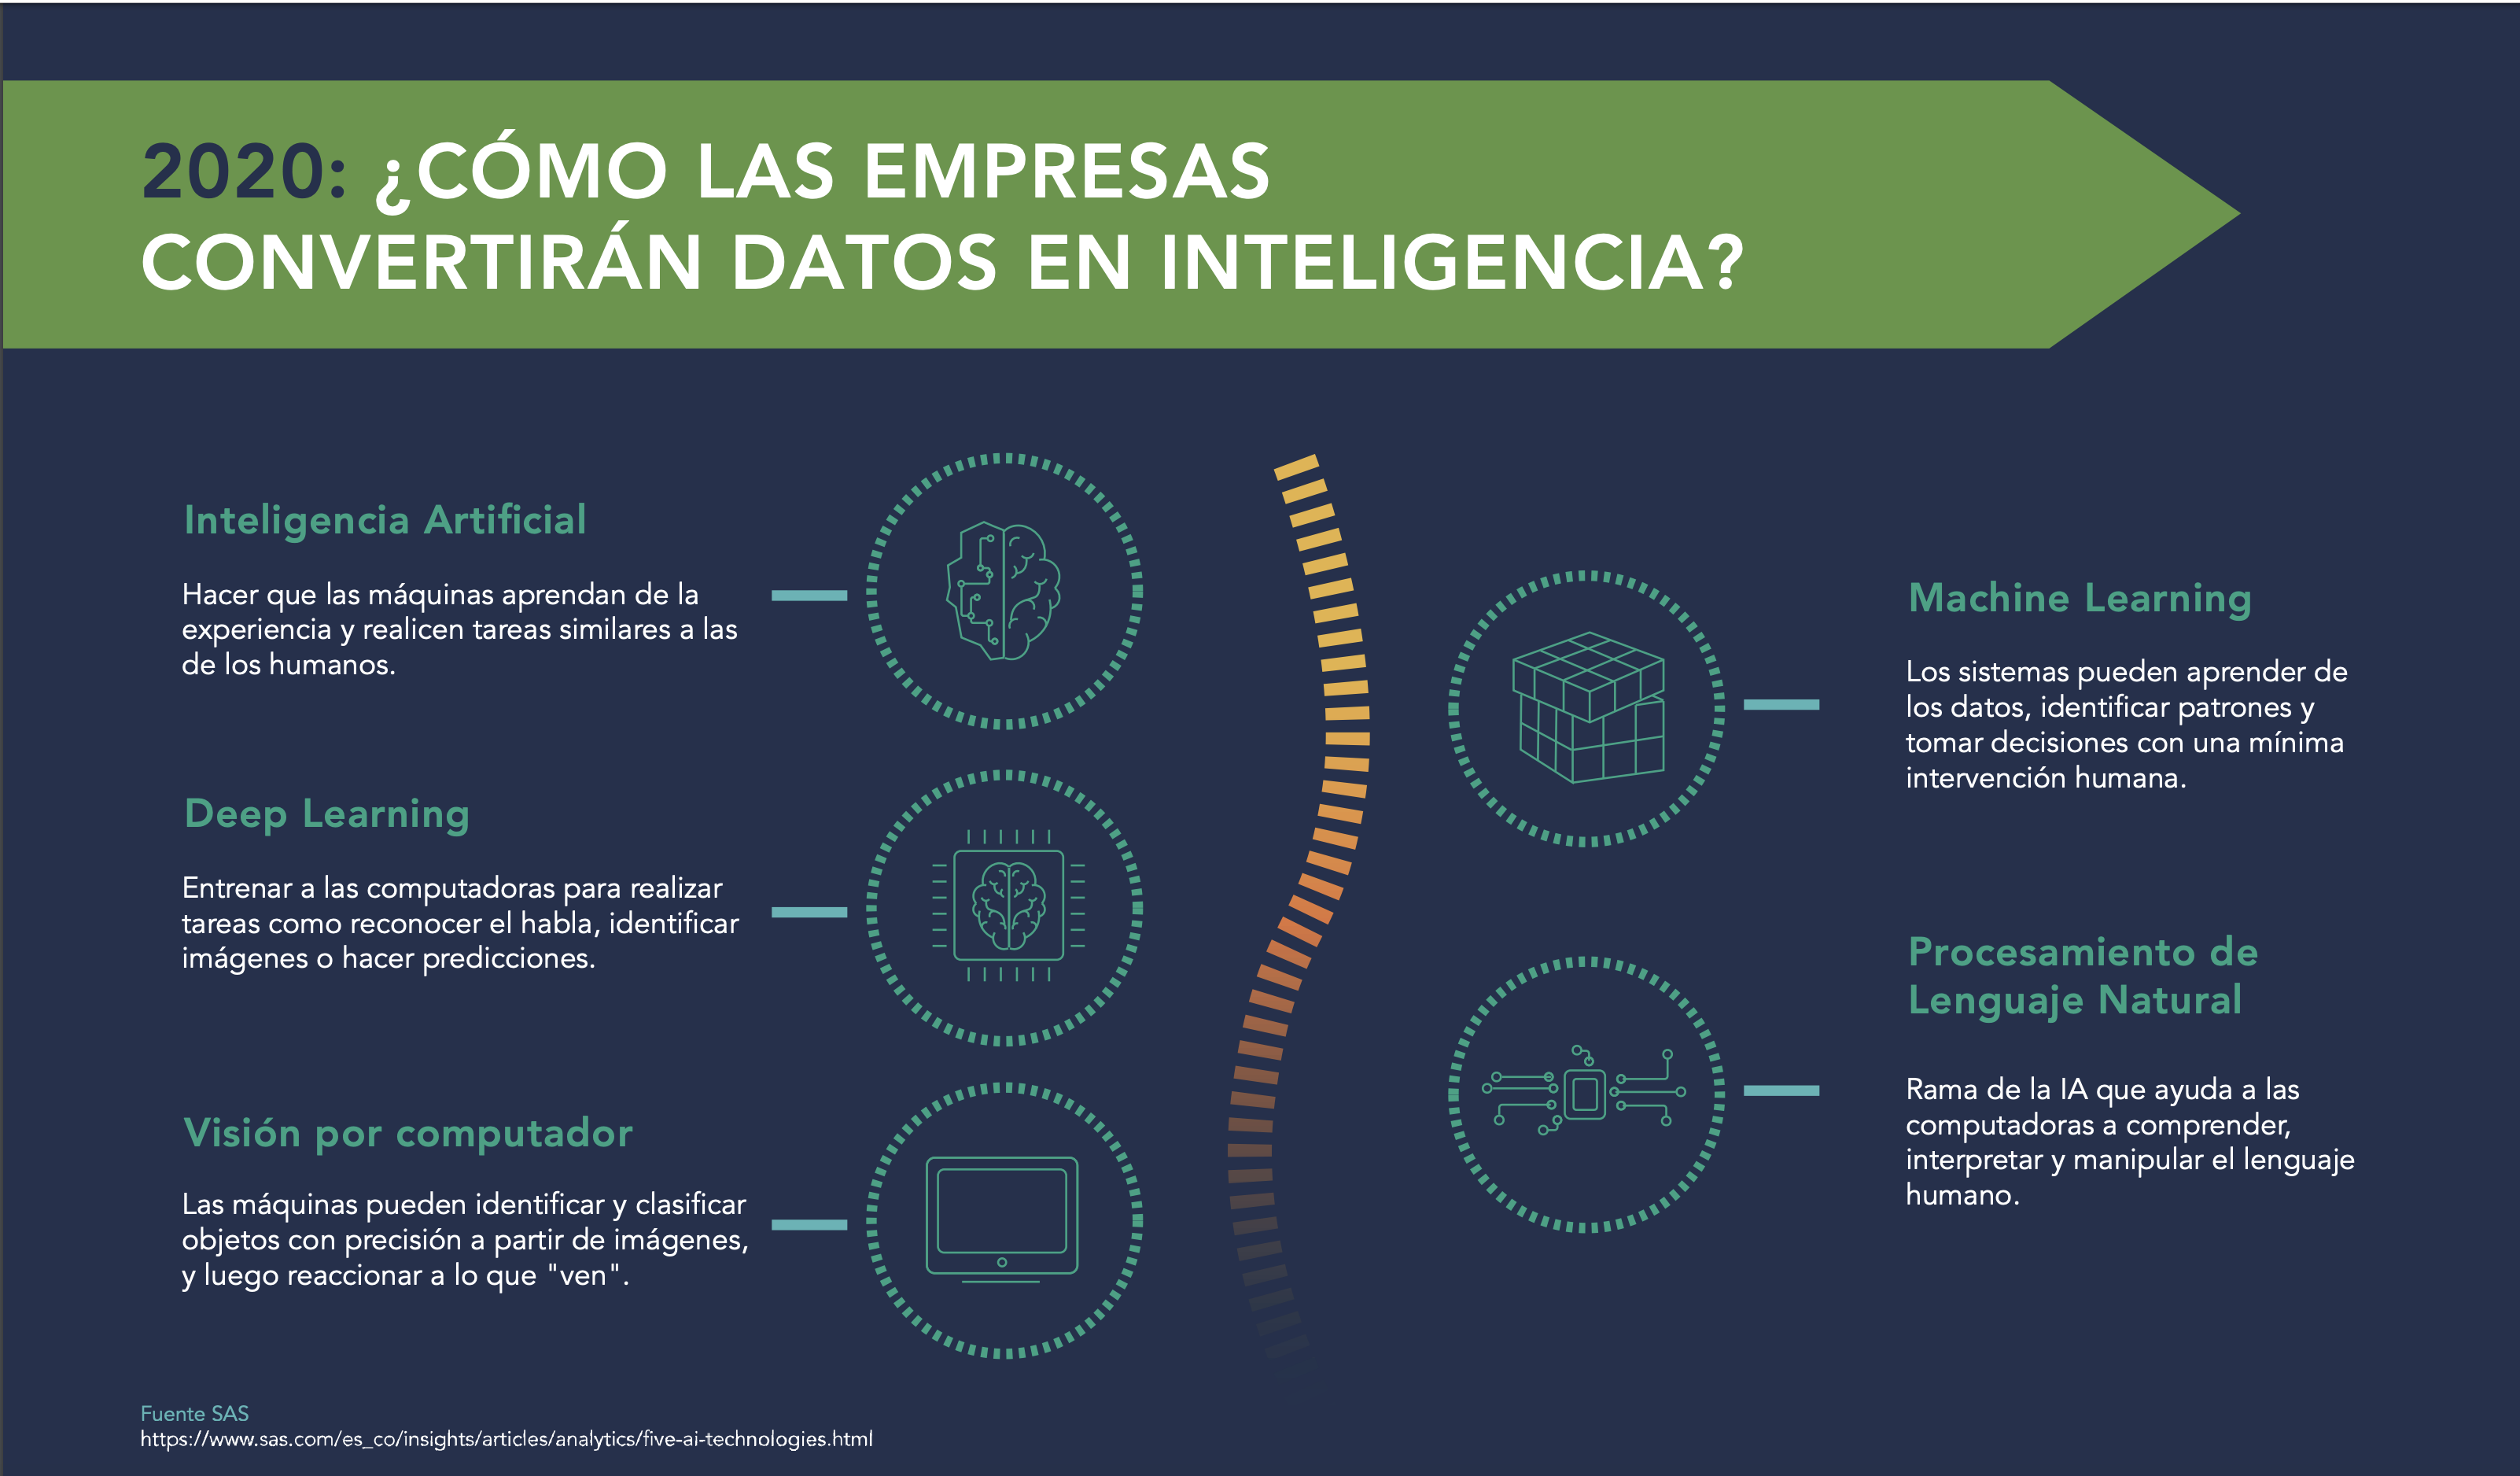

El mundo ha estado escuchando de Inteligencia Artificial desde 1956 y si cree que el 2019 ya estuvo suficientemente saturado este tema, prepárese: todo lo que ha pasado hasta ahora no es más que el comienzo. El 2019 fue un año en el que IA brilló con intensidad impulsando la