All Posts


If you have been using SAS for long, you have probably noticed that there is generally more than one way to do anything. (For an example, see my co-author Lora Delwiche’s blog about PROC SQL.) The Little SAS Book has long covered reading and writing Microsoft Excel files with the
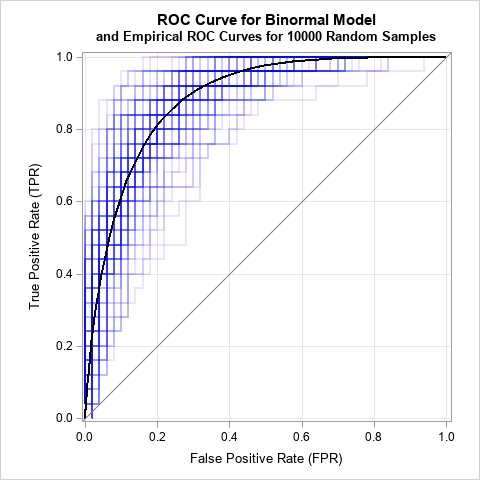

In a previous article, I discussed the binormal model for a binary classification problem. This model assumes a set of scores that are normally distributed for each population, and the mean of the scores for the Negative population is less than the mean of scores for the Positive population. I

I caught up with Jaimy van Dijk, one of our youngest female SAS Data Scientists who has proven herself to be a true Rockstar.


Escuchamos con frecuencia que las mujeres se están empoderando. Las vemos asumiendo roles de liderazgo en prácticamente todas las disciplinas: política, economía, investigación, astronomía, literatura y tecnología, por mencionar sólo algunas. Se podría afirmar que hoy sus capacidades laborales e intelectuales compiten a la par de las de sus contrapartes


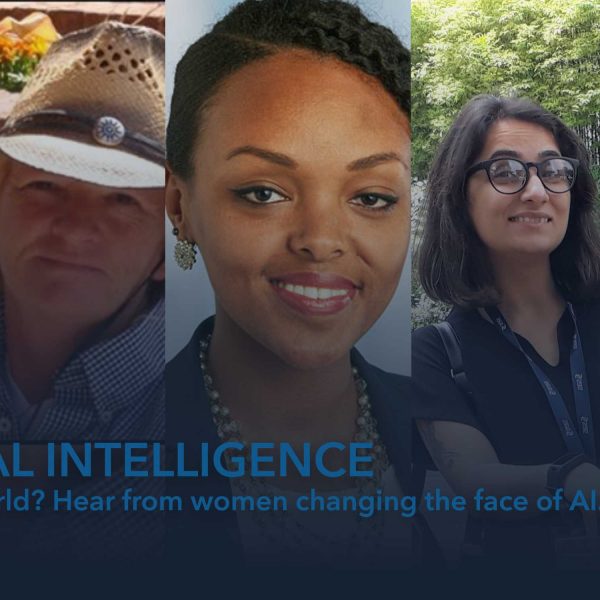
While I am a woman in computer science, let me start by saying that I’m a reluctant coder. I have an eye for data but find the abstract nature of many computer languages to be very challenging and not something I typically love. My first experience with coding was in
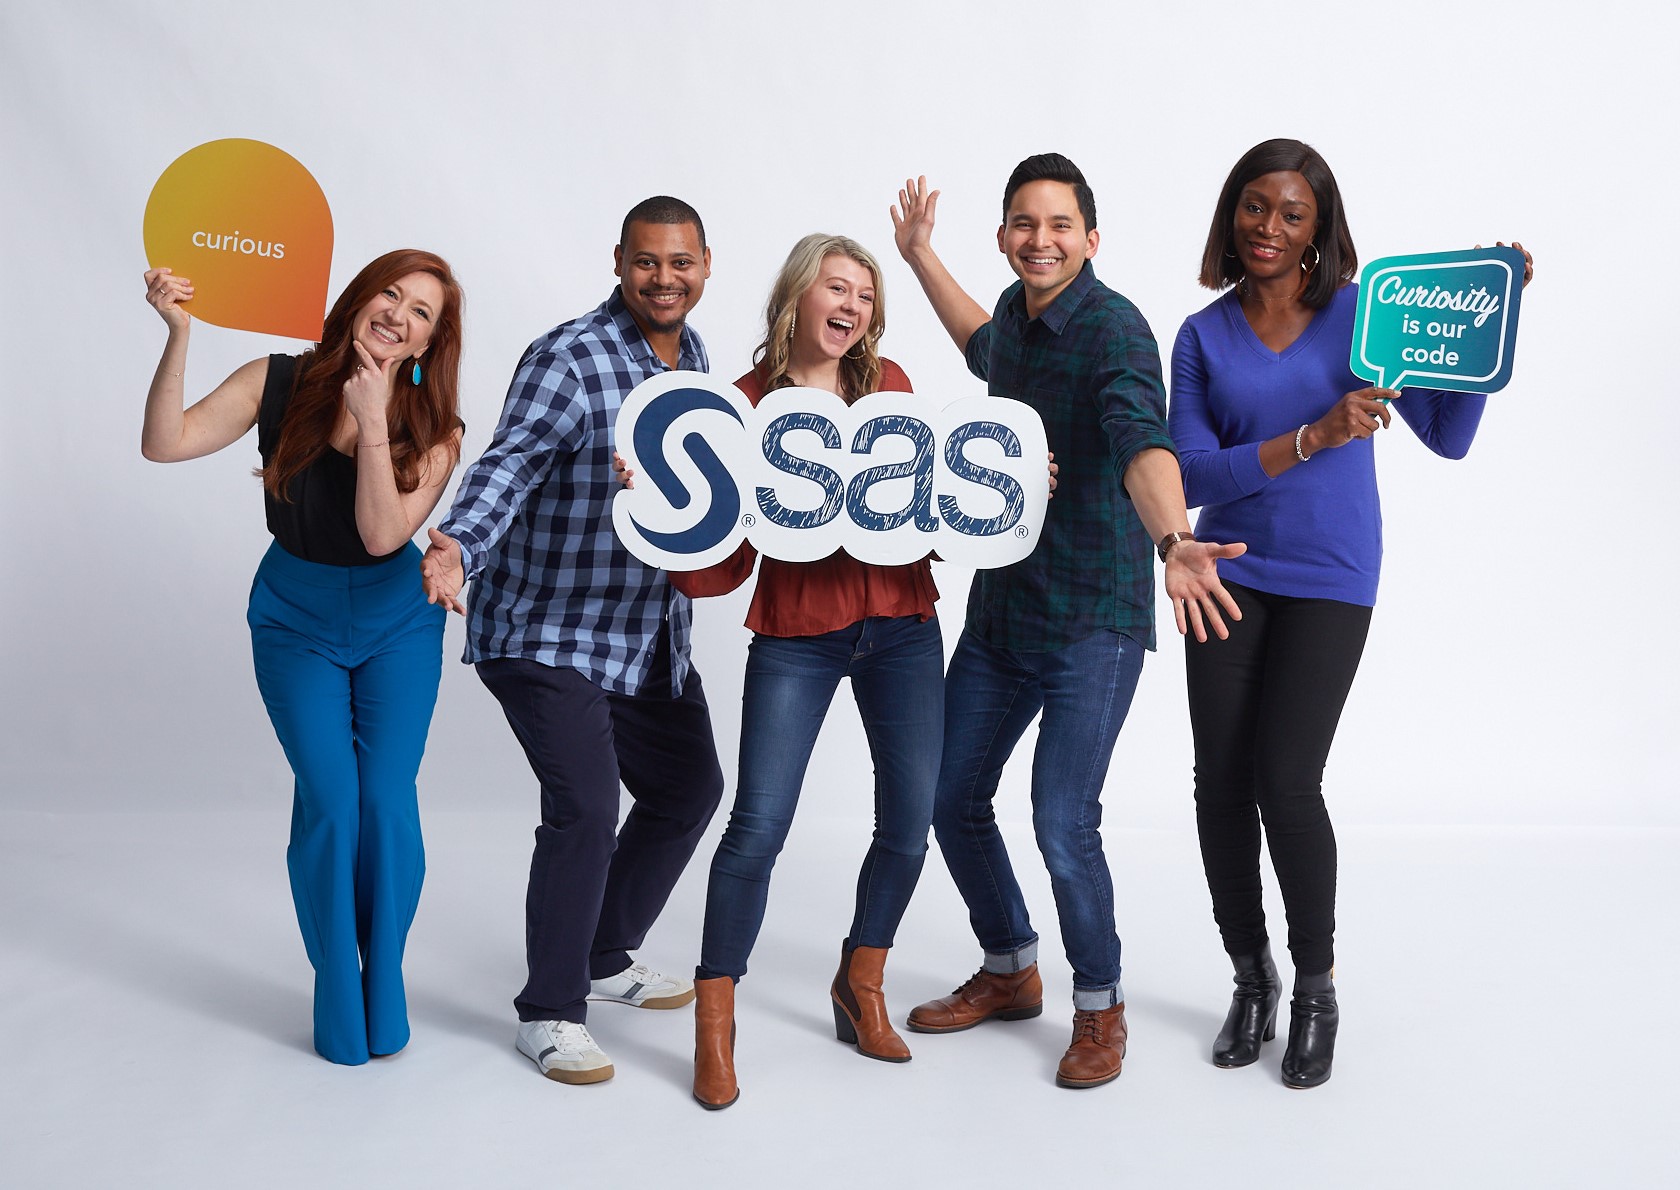

It’s Employee Appreciation Day! We appreciate our employees every day, but Employee Appreciation Day presents an extra opportunity to recognize our people for all they do. Our employees span across divisions, geographies and job functions – but they all play an important part in our mission to empower and inspire


Voor een succesvolle digitale transformatie is een innovatiecultuur noodzakelijk. Hoe realiseer je dit in de publieke sector?


Have you heard that SAS offers a collection of new, high-performance CAS procedures that are compatible with a multi-threaded approach? The free e-book Exploring SAS® Viya®: Data Mining and Machine Learning is a great resource to learn more about these procedures and the features of SAS® Visual Data Mining and


Companies face a stark choice between optimising customer experience and minimising fraud. But what if they could do both?

Fifty years ago, as the women’s liberation movement was gaining momentum in the U.S., my maternal great-grandmother, Pearl, worked in a factory sewing American flags while volunteering with the Girl Scouts and caring for her grandchildren. My paternal grandmother, Greta, also worked in local factories while caring for her family.


I'm a planner, and my plan was to have a completely natural birth and to breast feed only. This plan was written in stone (or so I thought). Long story short – my birthing plan flew out the window. One of my complications was very high blood pressure, which refused


Did you know that you can use SAS Enterprise Miner 15.1 to easily create an ASTORE? You can create an ASTORE from an HP SVM node, an HP FOREST node, and also from some SAS Viya Code Nodes! This blog will show you how.
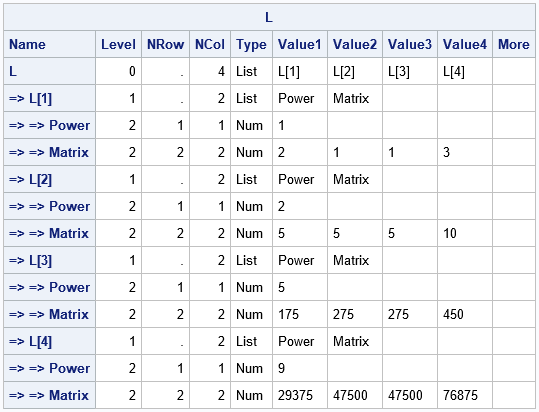
Suppose that a data set contains a set of parameter values. For each row of parameters, you need to perform some computation. A recent discussion on the SAS Support Communities mentions an important point: if there are duplicate rows in the data, a program might repeat the same computation several


Son temas complicados, cuyo origen no surge de una sola fuente, sino que se deben a una compleja combinación de factores, pues por lo general se trata de operaciones que aparentemente son lícitas cuando no es así. No obstante, hoy en día, la tecnología ha traído avances como la analítica,


Musik neu labeln mit KI: "Und irgendwann stand vor uns ein Gewinn von 10.000 Euro. Wir wussten nicht, was wir damit machen sollten.“