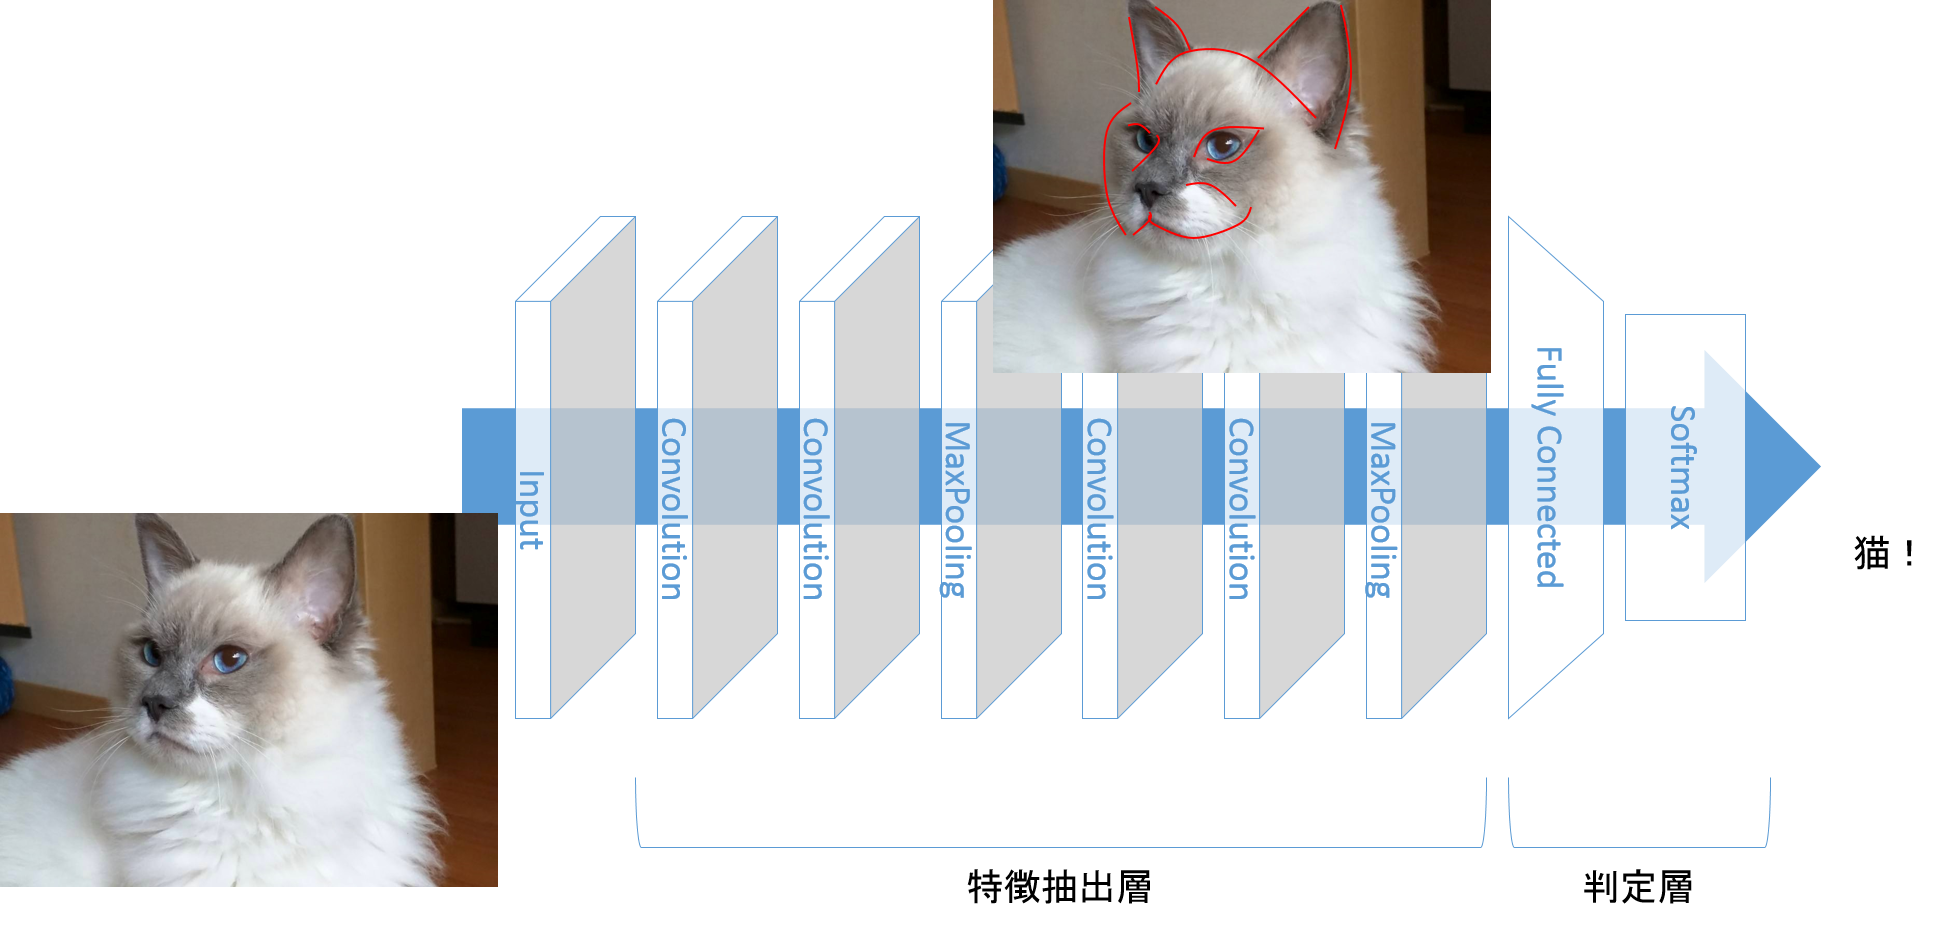
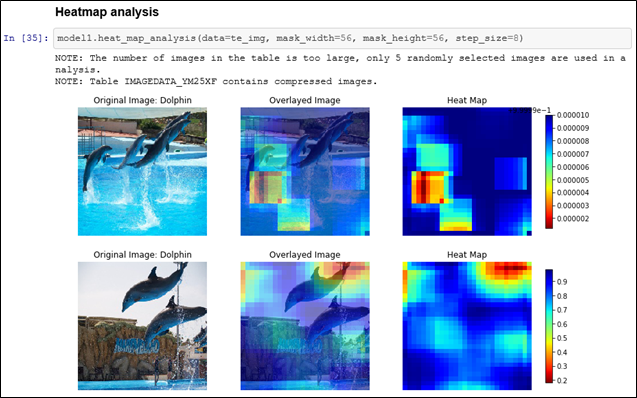
前回の「ディープラーニングの判断根拠」ブログでは、PythonからSAS Viyaの機能を活用するためのパッケージであるSWATを使用した例を説明しましたが、今回は、以下2点に関してご紹介します。 SAS ViyaのよりハイレベルなPython APIであるDLPyを使用した画像認識モデルの判断根拠情報 機械学習の判断根拠情報 1.SAS ViyaのよりハイレベルなPython APIであるDLPyを使用した画像認識モデルの判断根拠情報 この例では、複数のイルカとキリンの画像をSAS Viyaのディープラーニング(CNN)で学習させ、そのモデルに以下の画像を当てはめて、これがイルカなのか否かを判別するものです。 実際、この画像はイルカであると判定されたんですが。 SAS Viyaでは、その判断根拠となり得る情報の一つとして、入力画像のどこに着目したのかを以下の通り出力し、確認できるようになっています。 DLPyでは、get_feature_maps()メソッドでfeature mapを取得し、feature_map.display()で指定したレイヤーの内容を表示することができます。 以下は、レイヤー1のfeature mapです。 以下は、レイヤー18のfeature mapです。 白色の濃淡で、判別に影響を与えている箇所を確認することができます。 さらに、SAS Viyaでは、画像認識モデルの判断根拠情報を可視化する手法の一つである、Grad-CAMと同様に、画像の何処に着目したのかを、カラフルなヒートマップとして出力し、確認することもできるようになっています。 しかも、heat_map_analysis()メソッドを使用して、以下の通り、たった1行書くだけでです。 青、緑、赤の濃淡で、判別に影響を与えている箇所を確認することができます。 DLPyの詳細に関しては、以下をご覧ください。 https://github.com/sassoftware/python-dlpy 2.機械学習の判断根拠情報 もちろんディープラーニングだけではなく、従来からの機械学習のモデルによって導き出された予測や判断に関しても、それがなぜ正しいと言えるのか、具体的に言えば、なぜAさんはこの商品を買ってくれそうだと判断されたのか、なぜこの取引データは疑わしいと判断されたのか、を説明する必要性があるわけです。特に説明責任が求められるような業務要件においては、 ということでSAS Viyaの次期版には機械学習の判断根拠情報、モデル内容を説明するための機能が実装される予定です。 まず、影響度が最も高い変数は、という問いに対しては、従来からの変数の重要度で確認することができます。これをさらに一段掘り下げたものが、Partial Dependence (PD)です。 日本語では「部分従属」と言いますが。重要度の高い変数は、予測に対して、具体的にはどのように作用しているのかを知ることができます。 そしてこのPDを元にさらに一段掘り下げたものが、Individual Conditional Expectation (ICE)になります。 また、これらとは別に、なぜその予測結果に至ったのかを説明するテクニックとしてLocal Interpretable Model-agnostic Explanations (LIME)を活用することができます。 SAS Viyaベースの製品であるSAS Visual Data Mining and
Search Results: viya (1083)
DESCENDING BY Variables in DATA Step Code that Runs Distributed in SAS Viya
You can now enable Kerberos delegation across the SAS Platform, using a single strong authentication mechanism across that single platform. As always with configuring Kerberos authentication the prerequisites, in terms of Service Principal Names, service accounts, delegation settings, and keytabs are important for success.
When speed is required at scale, it's hard to beat parallel processing data in memory with DS2 and SAS® Viya® with the amazing Cloud Analytic Services (CAS)!
Learn about the new feature of SAS Viya 3.3 that enables Kerberos delegation throughout the environment. It allows you to have end-user sessions in SAS Cloud Analytics Services that are able to use Kerberos to connect to Secured Hadoop.
With the release of SAS Viya 3.3, you now have the ability to pass implicit SQL queries to a variety of SQL data sources, including Hive. Here's what happens as users write SAS compliant SQL code.
SAS Viya 3.3 introduced a set of command-line interfaces that SAS Viya administrators will find extremely useful. The command-line interfaces(CLI) will allow administrators to perform numerous administrative tasks in batch as an alternative to using the SAS Environment Manager interface. In addition, calls to the CLI’s can be chained together
In this article, I will set out clear principles for how SAS Viya 3.3 will interoperate with Kerberos. My aim is to present some overview concepts for how we can use Kerberos authentication with SAS Viya 3.3. We will look at both SAS Viya 3.3 clients and SAS 9.4M5 clients.
If you have worked with the different types of score code generated by the high-performance modeling nodes in SAS® Enterprise Miner™ 14.1, you have probably come across the Analytic Store (or ASTORE) file type for scoring. The ASTOREfile type works very well for scoring complex machine learning models like random
This article and accompanying technical white paper are written to help SAS 9 users process existing SAS 9 code multi-threaded in SAS Viya 3.3. Read the full paper, Getting Your SAS 9 Code to Run Multi-Threaded in SAS Viya 3.3. The Future is Multi-threaded Processing Using SAS® Viya® When I first began
One of the most exciting features from the newest release of Visual Data Mining and Machine Learning on SAS Viya is the ability to perform Market Basket Analysis on large amounts of transactional data. Market Basket Analysis allows companies to analyze large transactional files to identify significant relationships between items.
In this article, I want to give you an overview of the authentication options available with SAS Viya 3.3. SAS Viya 3.3, released in the second week of December 2017, and the second release with the new microservices architecture, presents more options for authentication than the previous releases. In future
2017年12月にSAS Viyaの最新版3.3がリリースされました。 これに伴い、皆様には、大幅に拡張されたSAS Viyaの機能を存分に体感いただくために今版から、皆様がお持ちの「実データ」でSAS Viyaベースのすべての製品を自由に触っていただけるようになりました。 ぜひ、ご利用ください! 利用手順に関しては、以下のブログをご覧ください。 SAS Viyaを体感してみよう! ~SAS Viya無償試用版利用ガイド~
Der Datensee wird immer voller. Aus allen Himmelsrichtugen fließen die Daten ein, nicht nur aus Exceltabellen oder aus Datenbanken, sondern zu großen Teilen aus operativen Systemen wie SAP ERP oder SAP HANA. Aber nicht genug: Sie kommen natürlich auch aus dem Internet in unseren See. Mobilen Endgeräten oder auch Sensoren an Maschinen
SAS Viyaがリニューアルされまして、ついにディープラーニングが登場しました! SAS ViyaのディープラーニングではオーソドックスなDeep Neural Network(DNN)から、画像認識で使われるConvolutional Neural Network(CNN、畳込みニューラルネットワーク)、連続値や自然言語処理で使われるRecurrent Neural Network(RNN、再帰的ニューラルネットワーク)まで利用可能になります。 ディープラーニングを使うことのメリットは、従来の機械学習やニューラルネットワークが苦手としている画像や文章を認識し、高い精度で分類や推論することが可能になります。 高い精度というのは、ディープラーニングのモデルによっては人間の目よりも正確に画像を分類することができるということです。 例えばコモンドールという犬種がありますが、この犬はモップのような毛並みをしていて、人間ではモップと見間違えることがあります。 これは犬? それともモップ? こういう人間だと見分けにくい画像に対しても、ディープラーニングであれば、人間よりも正確に犬かモップかを見分けることができるようになります。 というわけで、今回はSAS Viyaのディープラーニングを使って画像分類をしてみたいと思います。 ディープラーニングの仕組み 画像分類のディープラーニングではCNNを使います。 CNNは画像の特徴を探し出す特徴抽出層と特徴から画像を分類する判定層で構成されています。 特徴抽出層は主に畳込み層とプーリング層で構成されています。 畳込み層で入力画像に対し、ピクセルの特徴(横線の有無とか斜め線とか)を探し出し、プーリング層で重要なピクセルを残す、という役割分担です。 判定層は、特徴抽出層が見つけた特徴をもとに、画像の種類を分類します。 例えば犬と猫の分類であれば、特徴抽出層が入力画像から、面長で大きな鼻の特徴を見つけだし、犬と分類します。 または、丸っこい顔立ちと立った耳の特徴を見つけだし、猫と分類します。 SAS Viyaで画像を扱う SAS ViyaディープラーニングでCifar10をネタに画像分類をしてみたいと思います。 Cifar10は無償で公開されている画像分類のデータセットで、10種類の色付き画像60,000枚で構成されています。 各画像サイズは32×32で、色はRGBです。 10種類というのは飛行機(airplane)、自動車(automobile)、鳥(bird)、猫(cat)、鹿(deer)、犬(dog)、蛙(frog)、馬(horse)、船(ship)、トラック(truck)で、それぞれ6,000枚ずつ用意されています。 画像は総数60,000枚のうち、50,000枚がトレーニング用、10,000枚がテスト用です。 画像データは以下から入手することができます。 https://www.cs.toronto.edu/~kriz/cifar.html さて、Cifar10を使って画像分類をしてみます。言語はPython3を使います。 SAS Viyaで画像分類をする場合、まずは入手したデータをCASにアップロードする必要があります。 CASはCloud Analytics Servicesの略称で、インメモリの分散分析基盤であり、SAS Viyaの脳みそにあたる部分です。 SAS Viyaの分析は、ディープラーニング含めてすべてCASで処理されます。 CASではImage型のデータを扱うことができます。 Image型とは読んで字のごとくで、画像を画像フォーマットそのままのバイナリで扱えるということです。
Authorization determines what a user can see and do in an application. An authorization system is used to define access control policies, and those policies are later enforced so that access requests are granted or denied. To secure resources in SAS Viya there are three authorization systems of which you need to be aware. The General
ln SAS Viya, deployments identities are managed by the environments configured identity provider. In Visual SAS Viya deployments the identity provider must be an LDAP (Lightweight Directory Access Protocol) server. Initial setup of a SAS Viya Deployment requires configuration to support reading the identity information (users and groups) from LDAP. SAS Viya 3.3
SAS Viya is an exciting addition to the SAS Platform, allowing you to conduct analysis faster than ever before and providing you the flexibility to utilize open source technologies and generate insights from data in any computing environment. The blog post “Top 12 Advantages of SAS Viya” does a great
Esta es una historia típica en la solución de problemas en las industrias de cualquier giro, con una solución que todos han escuchado, pero no lo aplican por falta de información. Hoy conocerá a SAS VIYA, el complemento perfecto que lo introducirá en un mundo completamente nuevo de analítica para
There are many compelling reasons existing SAS users might want to start integrating SAS Viya into their SAS9 programs and applications. For me, it comes down to ease-of-use, speed, and faster time-to-value. With the ability to traverse the (necessarily iterative) analytics lifecycle faster than before, we are now able to generate
The goal of this article is to describe the steps needed to configure the bridge that allows SAS Data Integration 4.902, based on SAS 9.4M4, to load data directly into CAS on SAS Viya 3.2. Of course, SAS 9.4M5 simplifies this process, as a SAS/CONNECT communication will no longer be required, enabled
In a SAS Viya 3.2 environment two types of content can be created: SAS Visual Analytics Reports and Data Plans. For administrators, who may want to manage that content within a folder structure, there are some things to keep in mind. In the current release, both types of content can be
분석이 매 순간, 데이터가 존재하는 모든 곳에 적용된다면 어떤 일들이 가능해질까요? 오늘날 우리는 데이터가 사회와 경제를 움직이는 ‘데이터 이코노미’ 시대에 살고 있습니다. IDC는 오는 2025년 전 세계 데이터 양이 현재의 10배에 달하는 163제타바이트(ZB)에 이를 것으로 전망했는데요. 그러나 데이터는 그 자체만으로 유용하지 않습니다. 모든 데이터는 대기 시간과 유효 기간의 속성을 지니기
If you’re in the field of analytics, you’ve undoubtedly heard about SAS Viya. Designed for all analytic professionals, regardless of skills or experience, SAS Viya seamlessly handles big, complex, diverse data. It also supports any programming language, allowing analysts to choose the tool that makes them most productive. Recently a colleague
If you’ve got SAS running within your organization, which is likely considering that over 90 percent of the largest global firms have SAS, you’ve probably been hearing a lot about SAS® Viya™, which drives many of the latest enhancements of the SAS platform. But amidst all the talk about microservices
SAS Viyaで線形回帰を行う方法を紹介します。 言語はPythonを使います。 SAS Viyaで線形回帰を行う方法には大きく以下の手法が用意されています。 多項回帰: simpleアクションセットで提供。 一般化線形回帰または一般線形回帰: regressionアクションセットで提供。 機械学習で回帰: 各種機械学習用のアクションセットで提供。 今回は単純なサインカーブを利用して、上記3種類の回帰モデルを作ってみます。 【サインカーブ】 -4≦x<4の範囲でサインカーブを作ります。 普通に $$y = sin(x) $$を算出しても面白みがないので、乱数を加減して以下のようなデータを作りました。これをトレーニングデータとします。 青い点線が $$y=sin(x)$$ の曲線、グレーの円は $$y=sin(x)$$ に乱数を加減したプロットです。 グレーのプロットの中心を青い点線が通っていることがわかります。 今回はグレーのプロットをトレーニングデータとして線形回帰を行います。グレーのプロットはだいぶ散らばって見えますが、回帰モデルとしては青い点線のように中心を通った曲線が描けるはずです。 トレーニングデータのデータセット名は "sinx" とします。説明変数は "x"、ターゲット変数は "y" になります。 各手法で生成したモデルで回帰を行うため、-4≦x<4 の範囲で0.01刻みで"x" の値をとった "rangex" というデータセットも用意します。 まずはCASセッションを生成し、それぞれのデータをCASにアップロードします。 import swat host = "localhost" port = 5570 user = "cas" password = "p@ssw0rd"
SAS Viya deployments use credentials for accessing databases and other third-party products that require authentication. In this blog post, I will look at how this sharing of credentials is implemented in SAS Environment Manager. In SAS Viya, domains are used to store the: Credentials required to access external data sources. Identities
In this blog post I am going to cover the example of importing data into SAS Viya using Cloud Analytic Services (CAS) actions via REST API. For example, you may want to import data into a CASLib via REST API. This means you can perform an import of data outside
SAS Viyaでは購入前に使い勝手を試していただくため、無償使用版を提供しています。 https://www.sas.com/ja_jp/software/viya.html#preview もう試していただいた方もいらっしゃるかもしれませんが、SAS StudioやJupyter Notebook、Visual AnalyticsからSAS Viyaを操作して、データマイニングや機械学習を便利に試していただくことが可能です。 この無償使用環境では動作確認済みのデモプログラムを提供していますので、機械学習やプログラミングに不慣れでも迷うことはありません。 しかし機械学習を実業務で使い始めようとすると、どのプロシージャやメソッドを使えば良いのか、わからなくなることが多々あります。 SAS Viyaでは機械学習ユーザに不足ないよう、多種多様なプロシージャを提供していますが、プロシージャが増えるとどの場面でどれを使うんだっけ?と迷ってしまいます。 そこで、SAS Viyaのチートシートを作ってみました。 このチートシートを使えば、用途にあわせて必要なプロシージャを選択していくことができます。 SAS Viyaが提供するプロシージャから重要なものを掲載しています。 SAS ViyaはSAS PROCとActionsetという2種類のプログラミング仕様があります。 チートシートもPROC用とActionset用で2種類作りました。 PDF版は以下にありますので、ぜひご参照ください。 viya_cheat_sheet_20170721_jp
In SAS Viya 3.2, SAS Visual Data Builder provides a mechanism for performing simple, self-service data preparation tasks for SAS Visual Analytics or other applications. SAS Visual Data Builder is NOT an Extract, Transform and Load (ETL) or data quality tool. You may still need one of those tools to