One of the most exciting features from the newest release of Visual Data Mining and Machine Learning on SAS Viya is the ability to perform Market Basket Analysis on large amounts of transactional data. Market Basket Analysis allows companies to analyze large transactional files to identify significant relationships between items. While most commonly used by retailers, this technique can be used by any company that has transactional data.
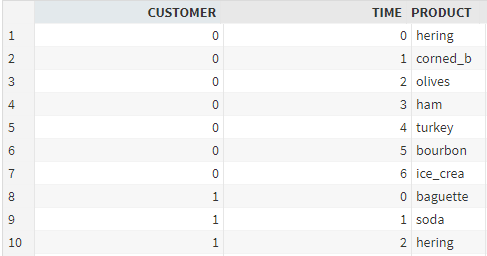
For this example, we will be looking at customer supermarket purchases over the past month. Customer is the Transaction ID; Time is the time of purchase; and Product is the item purchased. The data must be transactional in nature and not aggregated, with one row for each product purchased by each customer.
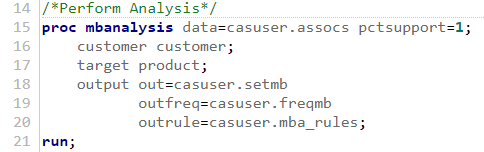
With our data ready, we can now perform the analysis using the MBANALYSIS Procedure. As illustrated below in SAS Studio, by specifying pctsupport=1, we will only look at items, or groups of items, that appear in at least 1% of the transactions. For very large datasets this saves time by only looking at combinations of items that appear frequently. This allows extraction of the most common and most useful relationships.
The MBANALYSIS procedure outputs a list of significant relationships, called Association Rules, by calculating the LIFT metric. A lift greater than one generally indicates that a Rule is significant. By default, each relationship has two items, although this can be changed to include multiple items.
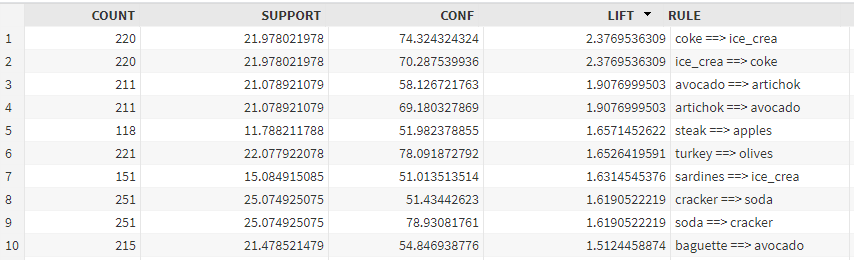
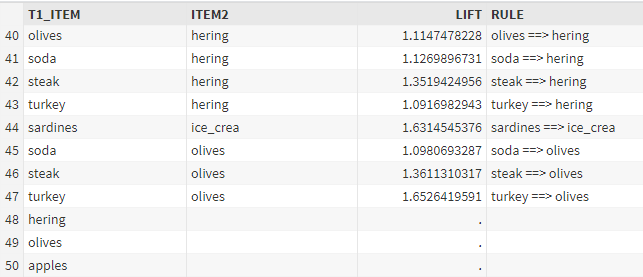
Below is a screenshot of the ten most important rules. The first item in the rule is the “Left Hand Side” and the second item after the arrow is the “Right Hand Side.” For the first rule, we can see that coke and ice cream appear together in 220 transactions and have a lift of 2.37, meaning purchasing Coke makes the purchase of ice cream about twice as likely.
Top 10 Association Rules
While Association Rules above give powerful insights into large transactional datasets, the challenge is exploring these rules visually. One way to do this is by linking the rules together via a Network Diagram. This allows users to see the relationships between multiple rules, and identify the most important items in the network. The following SQL code prepares the data for the Network Diagram.
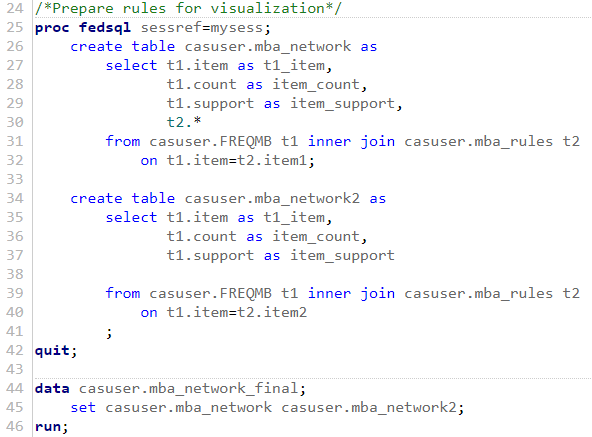
Network Diagrams plot a set of “Source” values (T1_ITEM), and connects them to a “Target” value (ITEM2). If the source value represents the left hand side of the rule, the corresponding right hand side of the rule is listed as the Target variable. We will use the “Lift” value to link these source and target variables. If the target value is the right hand side of the rule, the target and the lift are missing. This allows us to plot the product, but no linkage will be made.
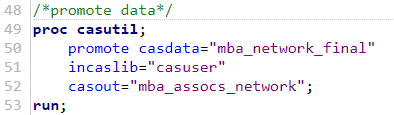
Now, my data is ready to be visualized as a Network Diagram. Using the following code, I am able to promote my Association Rules, making this dataset available via SAS® Visual Analytics.
Now, I am able to quickly and easily generate my Network Diagram without having to create any code.
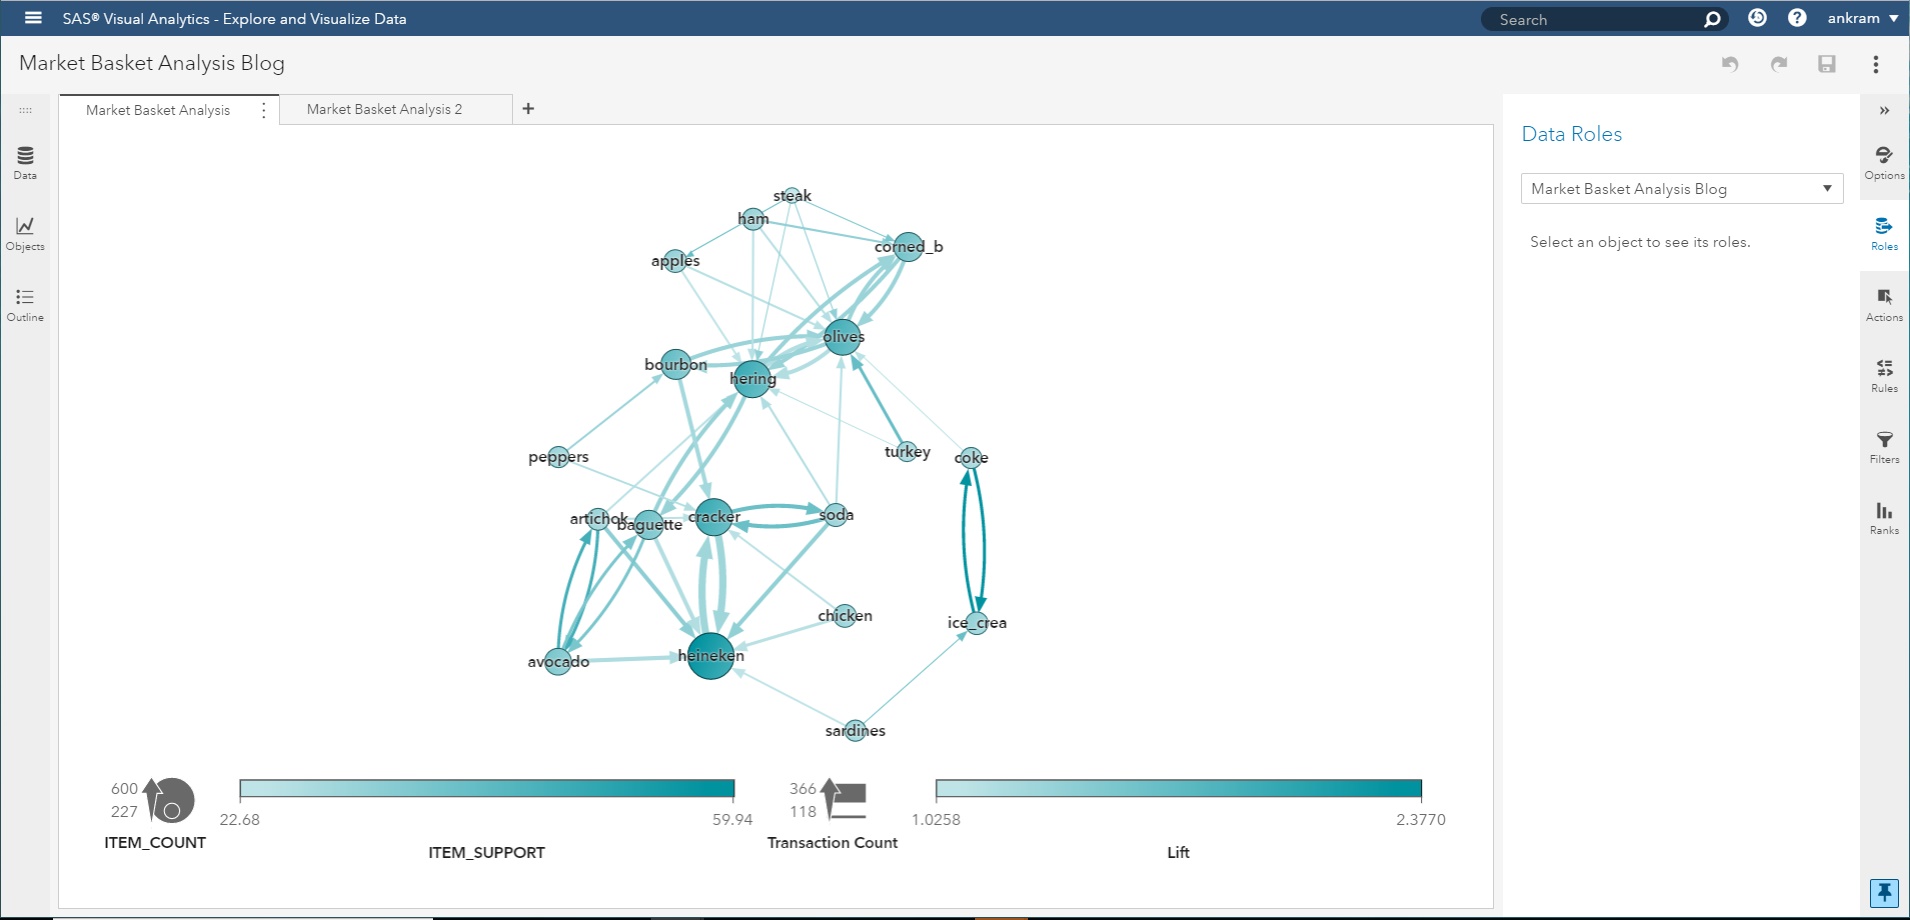
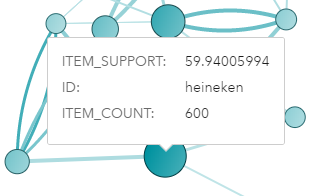
Hovering over a node allows me to see specific information about that particular item. Here, we can see that Heineken was purchased in 59.9% of all transactions, which is 600 transactions.
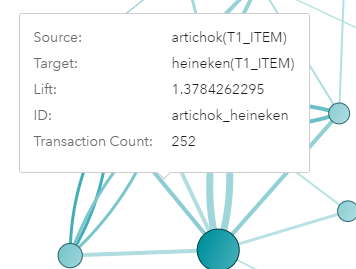
Hovering over the linkage, we can see specific information about the rule. Below, we can see that purchasing artichoke (artichoke) makes the purchase of Heineken about 38% more likely. Many other rules link to Heineken, showing its importance in the network. Business Unit Experts can use this diagram as a starting point to analyze selling strategies to make proper adjustments for the business.
Conclusion
The Market Basket Analysis procedure in Visual Data Mining and Machine Learning on SAS Viya can help retailers quickly scan large transactional files and identify key relationships. These relationships can then be visualized in a Network Diagram to quickly and easily find important relationships in the network, not just a set of rules. As transactional data, whether in-store, online, or in any other form gets bigger, this Market Basket functionality is a must have weapon in the analytical toolkit of any business.