
Making life easier for your data scientists

Phil Simon chimes in with some tips on how to set these folks loose.
Phil Simon chimes in with some tips on how to set these folks loose.

We have updated our software for improved interpretability since this post was written. For the latest on this topic, read our new series on model-agnostic interpretability. While some machine learning models – like decision trees – are transparent, the majority of models used today – like deep neural networks, random forests, gradient boosting
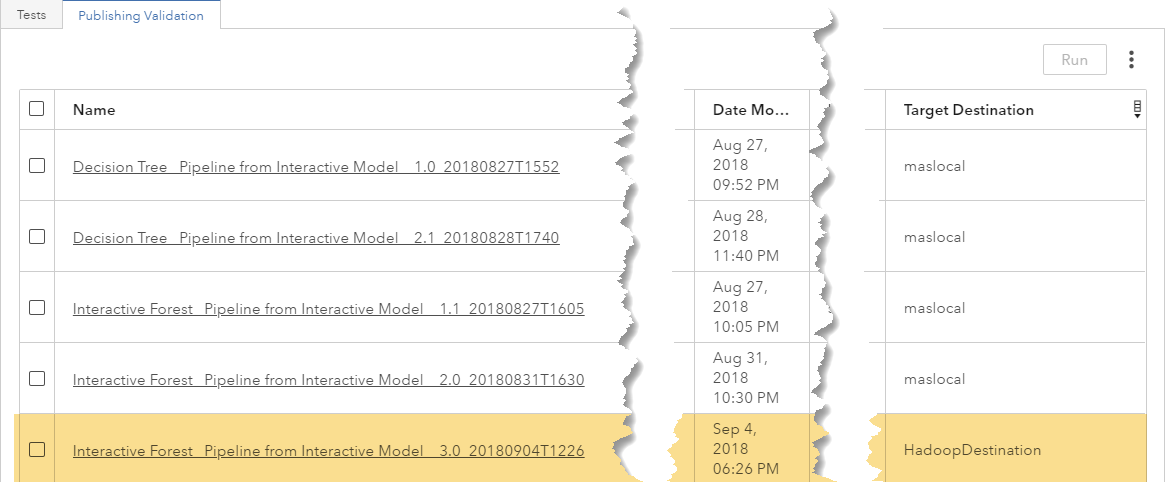
How do you deploy your model so that business processes can make use of it? This post explores how SAS Viya applications can directly add models to a model repository, and specifically focuses on how to deploy them with SAS Model Manager to Hadoop.

Deep learning has taken off because organizations of all sizes are capturing a greater variety of data and can mine bigger data, including unstructured data. It’s not just large companies like Amazon, SAS and Google that have access to big data. It’s everywhere. Deep learning needs big data, and now

What if you could automatically detect supply chain anomalies as they happen, or even predict them in advance? You'd be able to take timely corrective action and help maximize revenue, margins, customer satisfaction and shareholder value. There's no question: Supply chain planning and execution is complex. From design and sourcing, to

En los últimos 25 años las ciudades colombianas han venido expandiendo su territorio y han aumentado su demanda de recursos naturales y servicios vitales. Esto lo sustentan las cifras del DANE que muestran que en 2017, 76% de la población colombiana se concentró en ciudades frente a un 24% que
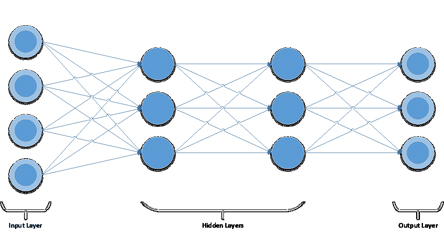
Deep learning (DL) is a subset of neural networks, which have been around since the 1960’s. Computing resources and the need for a lot of data during training were the crippling factor for neural networks. But with the growing availability of computing resources such as multi-core machines, graphics processing units

The Grand Buddha at Ling Shan, located on the northern bank of Taihu Lake near Wuxi, China is a fitting metaphor for smart city initiatives in China, specifically Wuxi in the Jiangsu Province in Eastern China. One of the largest Buddha statues in the world, the bronze monument reaches 88

고객 인텔리전스(CI)를 위한 챗봇 이미 많은 기업들이 인공지능(AI)으로 비즈니스를 자동화하고, 더 나은 고객 경험을 제공하며, 매출을 높이고 있습니다. 이미 수년 전부터 은행은 인공지능을 활용해 잠재적인 금융 사기를 탐지하고, 통신사는 고객 이탈을 예측해왔는데요. 챗봇은 한 단계 더 나아가 인공지능을 일상 가까이로 가져왔습니다. 챗봇은 머신러닝, 딥러닝, 음성 인식(voice-to-text), 자연어처리(NLP), 추천 엔진 등 여러
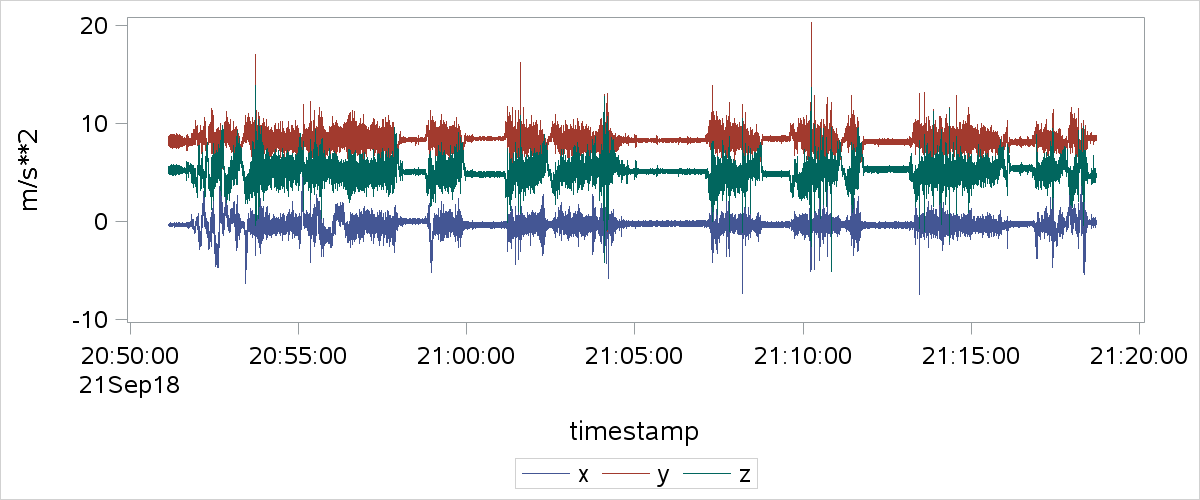
How to extract driving patterns by using smartphone sensors -- especially the accelerometer. With accelerometer readings in hand, you can use spectral analysis and other techniques to decompose events, and machine learning to match differentiate from patterns of risky drivers.

Soy muy optimista en cuanto las perspectivas de adopción de la analítica avanzada en áreas como la inteligencia artificial (AI). Especialmente porque existe una verdad innegable: los tomadores de decisión son, en su mayoría, compañías que conocen la necesidad de incursionar en el uso de analytics para obtener procesos más

How can you use analytics to design better biopsies and improve outcomes? This high school student has some ideas, and she presented them at Analytics Experience 2018.

데이터 사이언티스트들은 작업 시간의 대부분을 데이터 준비와 피처(feature) 엔지니어링에 할애합니다. 지난 블로그를 통해 데이터 준비 작업에 유용한 프로그래밍 팁을 소개해드렸는데요. 오늘은 인공지능(AI) 기반 엔터프라이즈 분석 플랫폼 ‘SAS 바이야(SAS Viya)’의 기본 템플릿 중 ‘자동화된 피처 엔지니어링 템플릿’을 활용해 손쉽게 예측 모델을 생성하는 방법을 살펴보고자 합니다. 피처는 입력과 변수(독립 변수, 설명 변수)를 의미합니다. 그리고 피처 엔지니어링은 예측
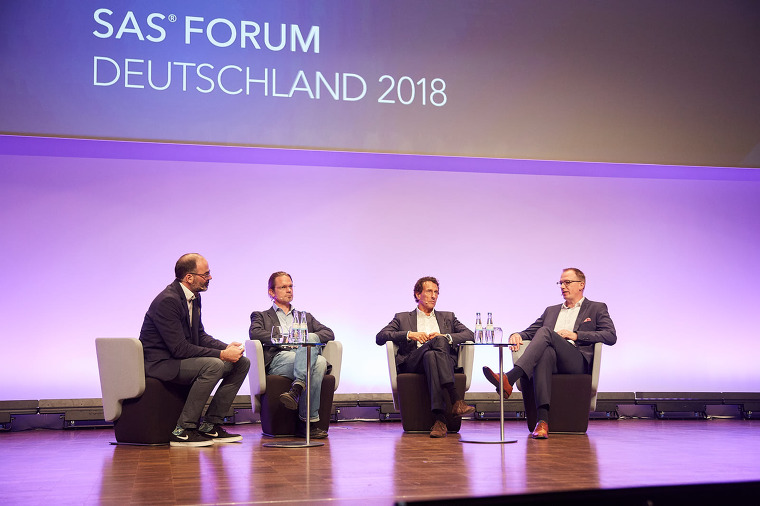
최근 독일에서 개최된 SAS 포럼에서는 데이터 과학 및 분석과 관련된 다양한 핸즈온(hands-on) 세션과 워크숍이 진행됐습니다. 이전 포럼에서는 볼 수 없었던 몇 가지 분석 동향의 큰 변화가 있었는데요. 주요 시사점을 소개합니다. 분석의 대중화 올해 워크숍의 티켓은 일찍부터 매진이었습니다. 그 자체만으로도 기분 좋은 소식이지만, 사실 더 중요한 사실을 암시하는데요. 이는 참석자 모두가

El momento tecnológico actual y su acelerada evolución se soportan principalmente en el aprovechamiento de los datos. Sin embargo, si éstos no se procesan de manera oportuna y consistente, las tecnologías exponenciales tales como: la biotecnología, la robótica, la nanotecnología, la neurociencia, el Internet de las Cosas y la Inteligencia
Did you know that the call for content is now open for SAS Global Forum 2019? Get the details and see why next year's Conference Chair MaryAnne DePesquo is excited about the big event in Dallas, Texas, April 28-May 1, 2019.

I love data; I’m a real and unabashed data geek. I'm the sci-fi nerd who has fun with data from Star Wars and analyzes World of Warcraft logs using SAS. More importantly, I love what data can do. I love the way it can show people new insights and new ideas,

Soccer has been on my mind since the recent tournament in Russia, and fraud is always on my mind. Fighting fraud today means thinking about artificial intelligence (AI) and machine learning (ML). Everyone says so. Like me, you probably wonder how AI and ML work – especially in fraud. What

지난 7월 17일, 세계 이모티콘의 날을 맞아 애플, 유튜브, 페이스북 등 글로벌 기업들은 새로운 이모티콘을 공개하고 관련 설문조사 결과를 발표하는 등 다양한 이벤트를 진행했는데요. 많은 사람들이 습관처럼 사용하는 이모티콘은 온라인 비주얼 커뮤니케이션이라는 새로운 트렌드의 핵심 요소로 자리잡았습니다. 온라인, 특히 모바일에서 빠르고 명확하게 표현을 전달해야 할 때 이모티콘은 전 세계 누구와도
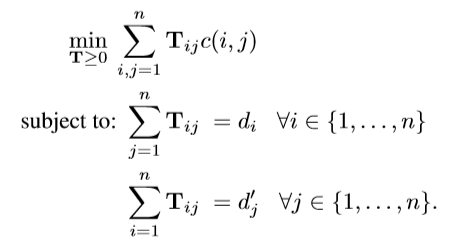
Word Mover's Distance (WMD) is a distance metric used to measure the dissimilarity between two documents, and its application in text analytics was introduced by a research group from Washington University in 2015. The group's paper, From Word Embeddings To Document Distances, was published on the 32nd International Conference on Machine
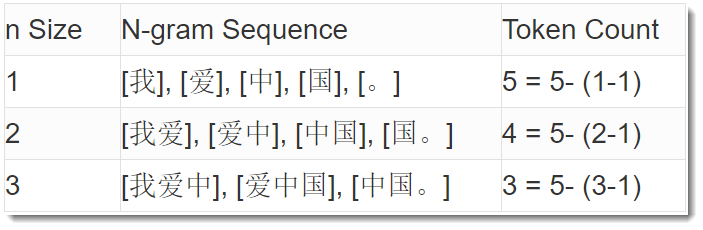
SAS Visual Text Analytics provides dictionary-based and non-domain-specific tokenization functionality for Chinese documents, however sometimes you still want to get N-gram tokens. This can be especially helpful when the documents are domain-specific and most of the tokens are not included into the SAS-provided Chinese dictionary. What is an N-gram? An
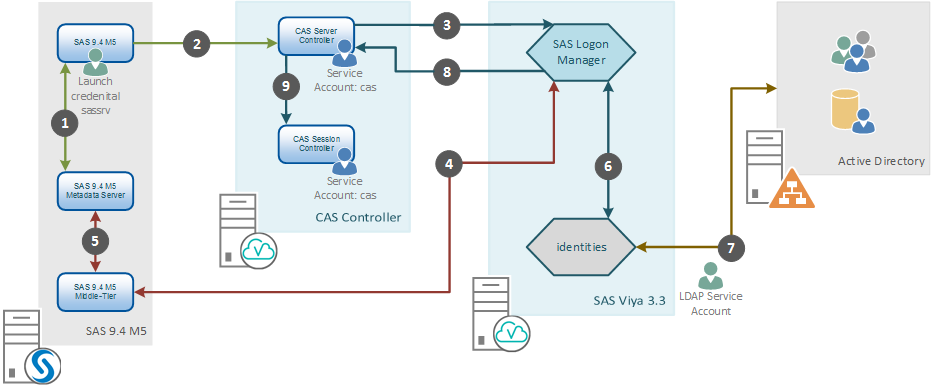
This post addresses connecting to SAS Viya using a One-Time-Password generated by SAS 9.4. We'll learn more about SAS Viya connecting with SAS 9.4 and talk about how this authentication flow operates and when we are likely to require it.

My local middle school publishes a weekly paper. Very recently, I noted an article in that paper regarding an expose on human trafficking overseas, "World Slavery: The Terrors Our World Tries to Forget." The eloquent article in part highlighted how children have been exploited in the fishing industry in Ghana

Num mundo de incertezas e desafios económicos, a importância da monitorização e medição do desempenho das organizações, conhecendo os comportamentos dos seus clientes e cumprindo as exigências regulatórias tornou-se evidente. Neste sentido, a Gestão de Informação, o Business Intelligence e o Analytics assim como a sua boa implementação, tornaram-se fatores críticos para a sobrevivência
You can still register for the 38th annual International Symposium on Forecasting, being held June 17-20 in Boulder, Colorado, at the foothills of the Rockies. Beyond the daily keynotes and over 150 presentations of new research, a separate Practitioner Track features talks on the application of forecasting research to organizational

SAS 솔루션으로 다양한 종류의 심층 신경망(DNN;Deep Neural Network) 모델을 구축할 수 있습니다. 구체적으로 컨볼루션 신경망(convolutional neural networks), 순환 신경망(recurrent neural networks), 순방향 신경망(feedforward neural networks), 오토인코더 신경망(autoencoder neural networks) 등을 생성할 수 있는데요. 오늘은 ‘SAS VDMML(Visual Data Mining and Machine Learning)'을 이용해 딥러닝 모델을 구축하는 방법을 자세히 설명해 드리고자 합니다. ‘SAS 클라우드 분석 서비스’를 활용한 딥러닝

15일 삼성동 코엑스 인터컨티넨탈 호텔에서 SAS 고객, 파트너, 산업별 전문가 650여명이 참석한 가운데 <SAS FORUM KOREA 2018>이 성황리에 개최됐습니다. 이번 포럼에서는 인공지능(AI), 머신러닝, 사물인터넷(IoT) 등 최신 기술을 활용한 고급 분석 전략과 다양한 비즈니스 혁신 사례가 논의됐는데요. 지금부터 그 현장의 하이라이트를 소개합니다! 먼저 오병준 SAS코리아 대표이사가 환영사를 통해 오늘날 애널리틱스 이코노미

Landmark population health study involving 50,000 northern Nevadans turns to SAS to reveal hidden health insights These are exciting times in health care. Earlier this week I read that the NIH will soon open enrollment for its “All of Us” initiative. The research program aims to compile the genetic and health
As health care evolves, its entire ecosystem – from payers and providers to pharmaceutical companies and government agencies – seeks to find common ground. More data is available than ever. But transforming information into innovation is challenging. Organizations strive to create shared goals, internally and externally, trying to improve patient
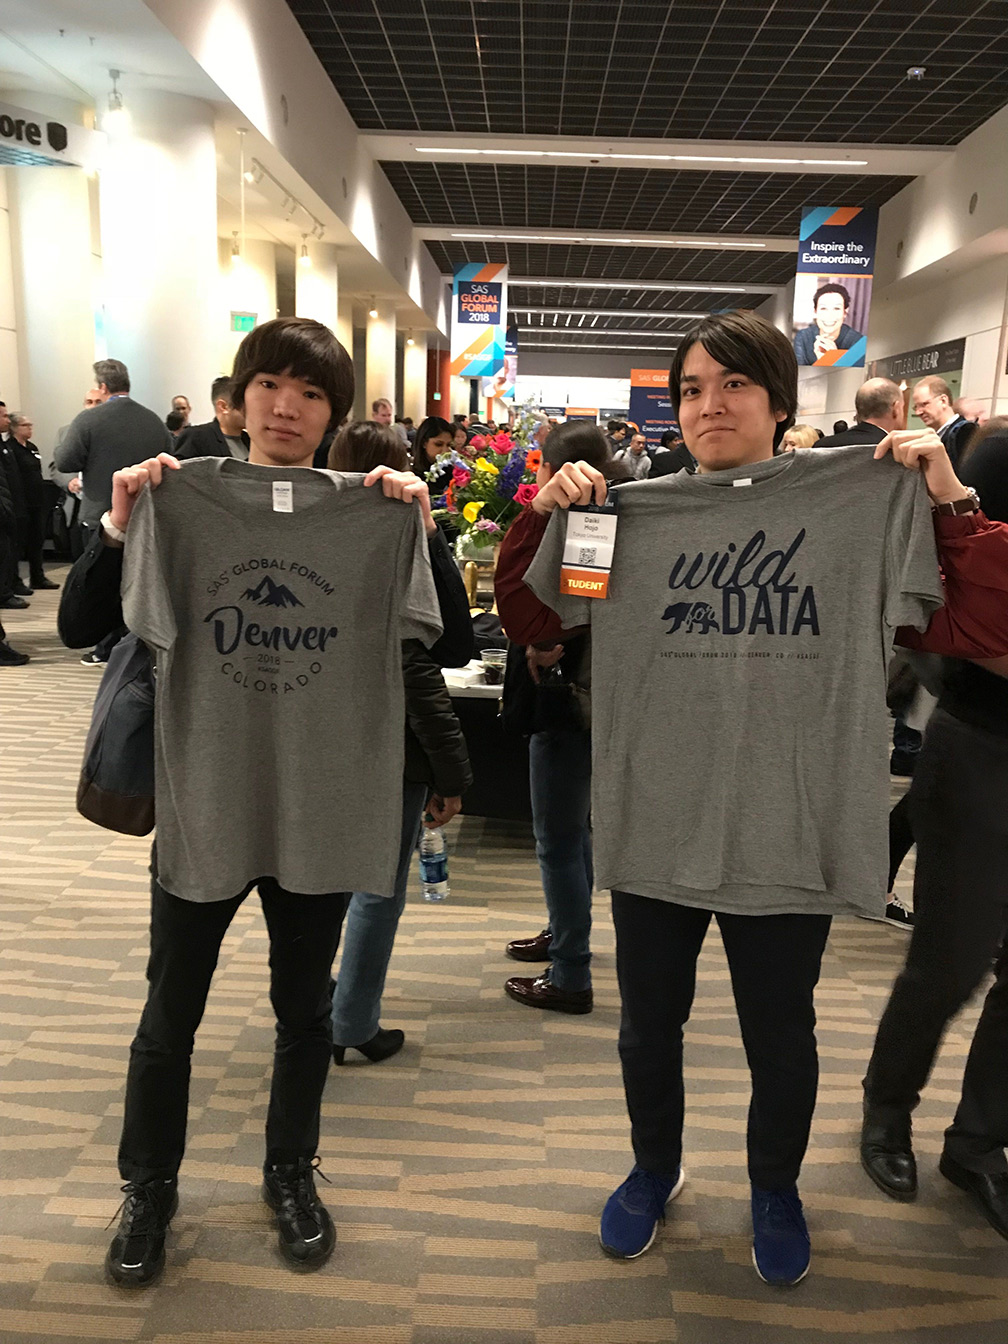
4月8日から9日まで、米国コロラド州デンバーにおいて、年次のSASグローバルイベント「SAS Global Forum」が開催されました。 今年のSAS Global Forumには、2月に開催された和歌山県データ利活用コンペティションにてSAS賞を受賞した専修大学のチームを招待しました。 SAS Global Forumでは、毎回、学生・教員が参加するAcademic Summitが開催されますが、今年も4月8日に開催された本イベントをレポートいたします。