Tag: Business Intelligence

Analytics | Artificial Intelligence | Customer Intelligence | Internet of Things
Fernanda Benhami 0
Telecom: servicios de excelencia en tiempo real, la conexión directa con el cliente

Es evidente que las empresas de las telecomunicaciones operan hoy en un entorno complicado que las obliga a tomar decisiones estratégicas importantes que van a definir su negocio en el futuro. Específicamente, son cuatro los factores que influyen en dicho contexto y que tienen un peso significativo en el momento

Analytics | Artificial Intelligence | Data Management | Learn SAS
Marvio Portela 0
El CEO, el catalizador de la transformación digital de las empresas

La transformación digital es un fenómeno tecnológico y de negocio que continúa con una fuerte inercia dentro de las organizaciones de todas las industrias. Esta inercia ha sido impulsada de forma importante durante la actual pandemia, y se prevé que permanezca como uno de los temas centrales en la agenda

Learn SAS | SAS Events
Dina Duhon 0
What makes SAS Global Forum great?

The people, the energy, the quality of the content, the demos, the networking opportunities…whew, all of these things combine to make SAS Global Forum great every year. And that is no exception this year. Preparations are in full swing for an unforgettable conference. I hope you’ve seen the notifications that

Analytics | Data Visualization
Gregor Herrmann 0
So klappt’s mit der Migration von Business Intelligence & Co.

Business Intelligence (BI) begleitet uns schon seit geraumer Zeit – und zwar in ganz unterschiedlichen Ausprägungen. Und das Thema wird immer wichtiger und verändert sich im gleichen Maße, wie Unternehmen den Wert datengetriebener Entscheidungen erkennen. Damals und heute BI war in „jungen Jahren“ geprägt von teuren, komplexen Systemen, die sich

Data Visualization | Learn SAS | SAS Events
Scott Hicks 0
Why Maps matter: Lessons learned from London's 1854 Cholera outbreak

The catch phrase “everything happens somewhere” is increasingly common these days.  That “somewhere” translates into a location on the Earth; a latitude and longitude.  When one of these “somewhere’s” is combined with many other “somewhere’s”, you quickly have a robust spatial data set that becomes actionable with the right analytic

Data Visualization
セルフサービスBI&AIの決定版SAS Visual Analytics 8.3 on SAS Viya新機能概要

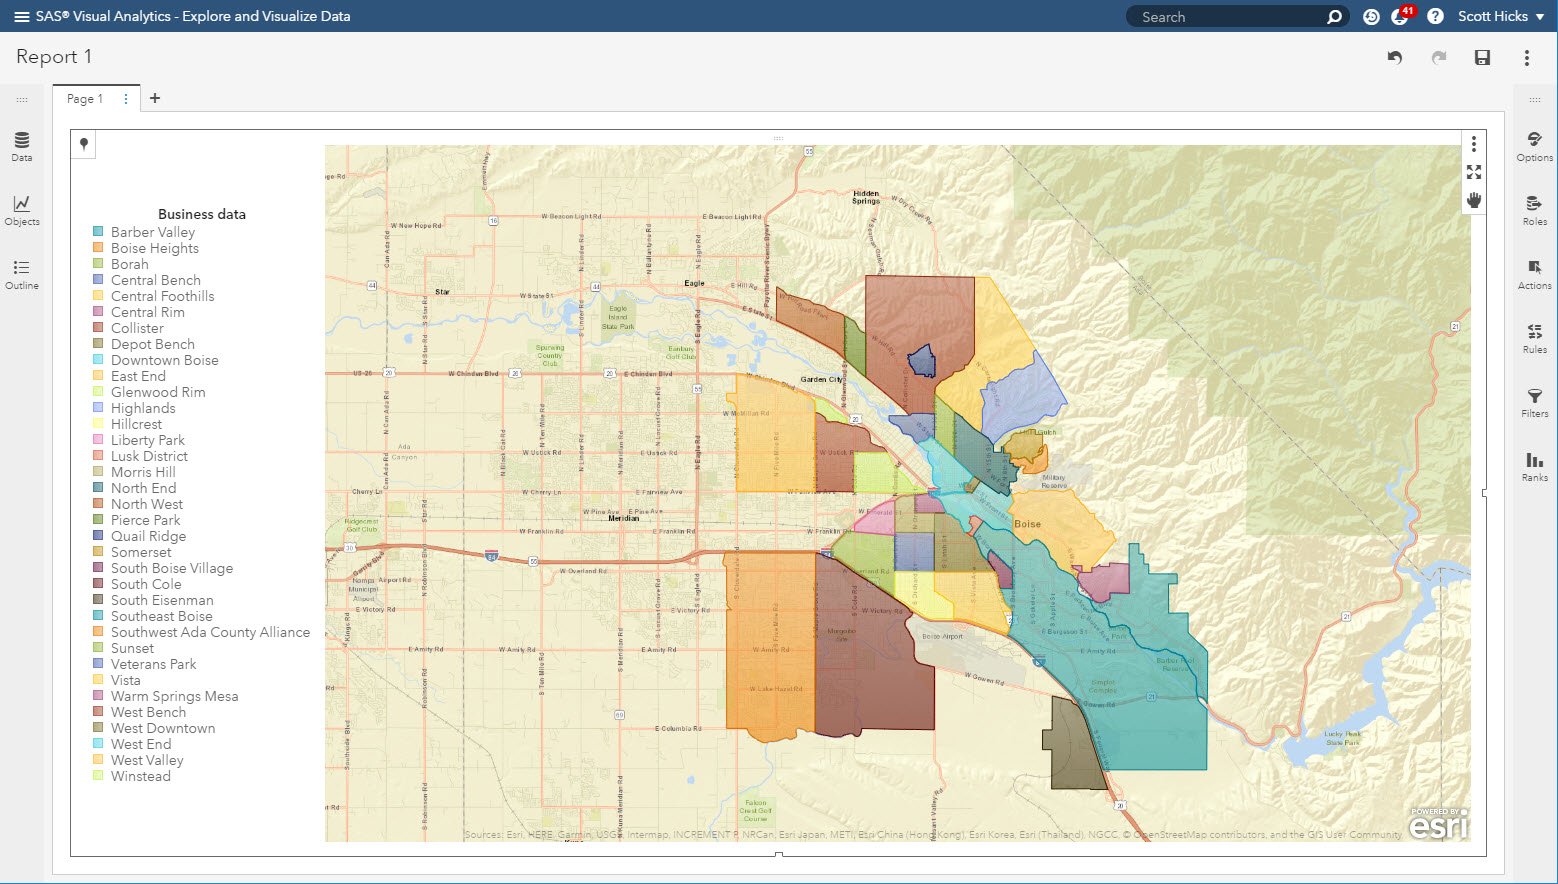
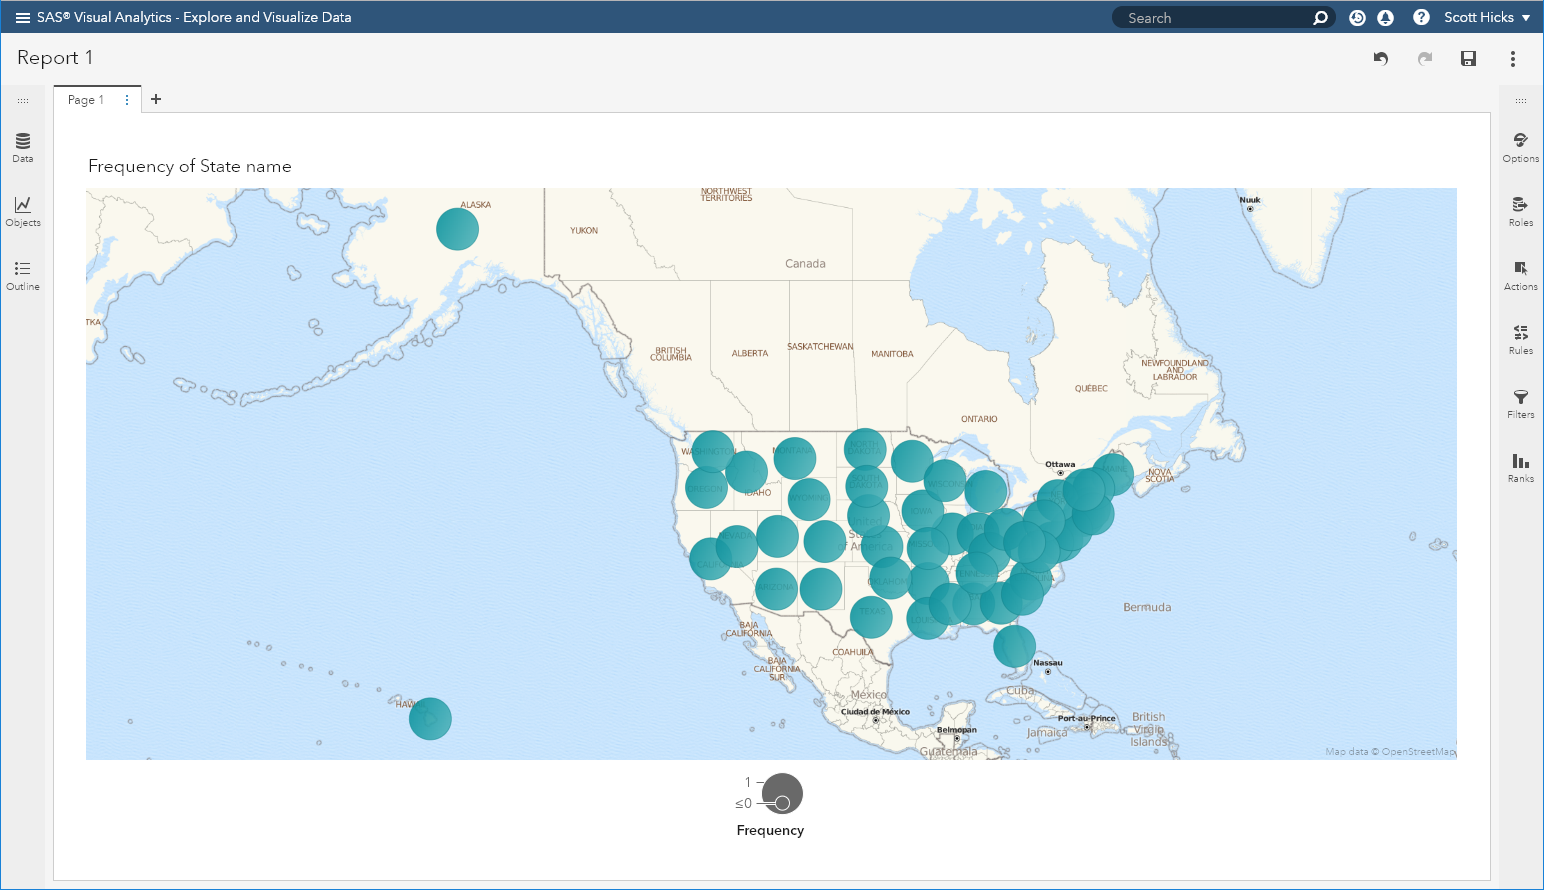
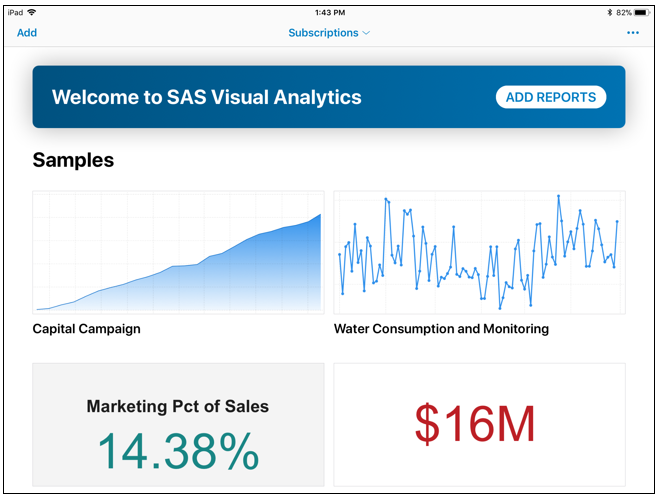
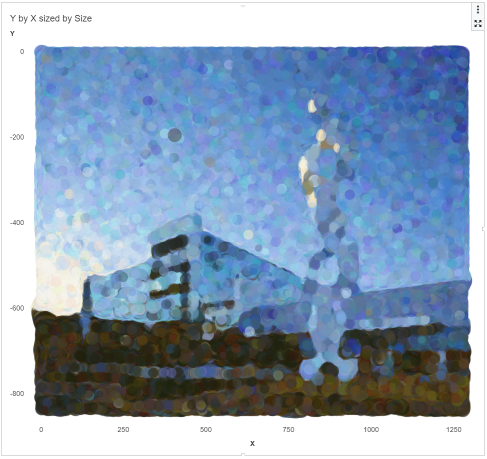
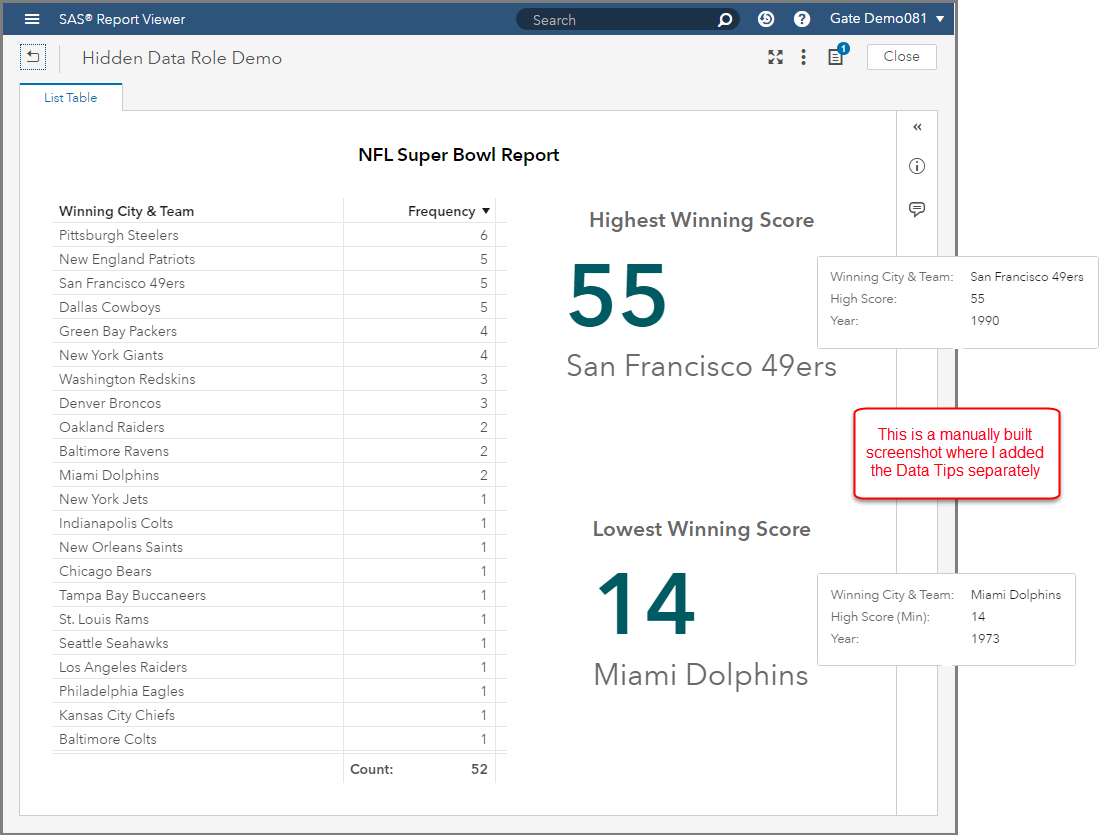
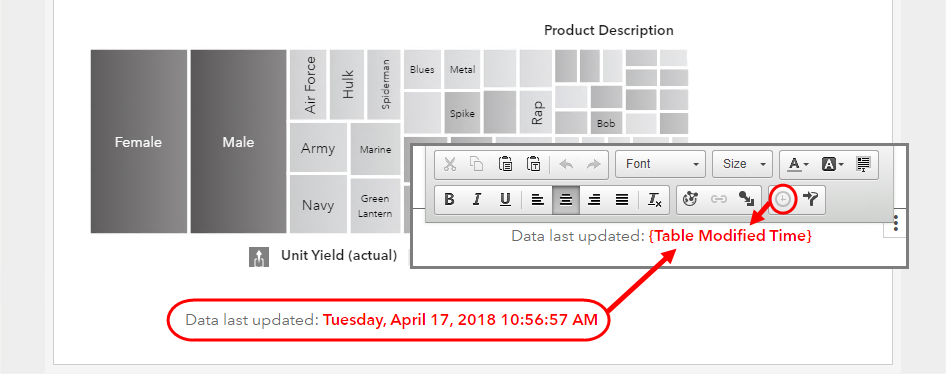
SAS Visual Analytics on SAS Viya(以降VA)の次期版8.3に搭載予定の新機能をダイジェストで紹介します。 レポート作成効率の向上 レポート表示能力の拡張 表形式オブジェクトの機能拡張 SAS Mobile SDK 1.レポート作成効率の向上 レポート作成や設定は1度だけ、後はこれを再利用し、レポート作成の効率を向上 1-1.レポートデータビュー 従来からVAではレポート作成・編集時、左側に表示される「データ」リスト画面内で、必要な階層項目や計算項目の作成、カスタムカテゴリーの作成、不要な項目の非表示、などを設定し、このデータビューに基づいてレポートを作成してきました。 VA8.3では、同じデータソースに基づく複数の異なるデータビューを定義し、これを異なるレポート間、ユーザー間で共有し、再利用することができるようになります。 同じデータソースに基づく、異なるレポートを作成する際の効率が大幅に向上します。 1-2.共通フィルター 従来は、オブジェクトごとに右画面内で設定できるフィルター(オブジェクトフィルター)を使用する場合、例えば、レポート内に3つのチャートオブジェクト(円グラフ、クロス表、棒グラフ)があり、円グラフと棒グラフにだけ同じ条件で絞り込みをかけたい場合は、円グラフと棒グラフの両オブジェクトにそれぞれ同じフィルターを設定する必要がありました。 VA8.3では、作成したフィルター定義を複数の異なるオブジェクトに再適用することが可能になります。さらに、このフィルター定義は共通フィルターとしてデータビューに保存し、「1-1.」項で紹介したように、レポート間、ユーザー間でも共有し、再利用が可能になります。 1-3.絞り込み条件保持 従来、レポート参照者がレポートを表示し、好みの条件を選択し、レポート表示内容を変更した場合、そのレポートを一旦閉じた後、再度同じ内容を参照したい場合は、再度同じ作業を繰り返す必要がありました。 しかし、VA8.3では、レポート参照時にレポートに対して行った最終操作結果状態を保持することが可能となり、レポート再表示時に、同じ作業を繰り返す必要が無くなります。 1-4.格子ガイド利用 VA8.3では、レポート作成・編集時に、背景にグリッドを表示し、レポートページ内のお好みの位置に、オブジェクトを正確かつ素早く配置することが可能になります。 2.レポート表示能力の拡張 レポートが、あなたに、ストーリーを語ります。 2-1.再生可能ダッシュボード 再生可能なダッシュボードを使用することで、レポート参照者は、静的ではなく動的なダッシュボードをフルスクリーンで体験することができます。 会議の場などで、PowerPointのスライドショーのように、BIレポートを効果的に表示することも可能です。 あなたが設定したタイミングで、設定した順序で、レポートページ単位やページ内オブジェクト単位で、ダッシュボード内容が自動再生されます。 2-2.レポート自動リフレッシュ機能拡張 従来のVAでは、レポート全体を最短1分間隔で自動リフレッシュすることが可能でしたが、VA8.3では、レポートのページ単位、ページ内のオブジェクト単位に、最短1秒間隔で自動リフレッシュが可能になります。 これによって、リアルタイムBIレポートモニタリングが実現されます。 例えば、ページ内の折れ線グラフは1秒間隔で、リアルタイムなデータの変動を表示し、棒グラフは2分間隔で、別のデータの更新状況を表示する、といったことが可能になります。 3.表形式オブジェクトの機能拡張 そのままでは、数値の羅列で、ビジネス状況を直感的に捉えるのは難しいリスト表やクロス集計表の表現力が拡張されます。 3-1.表のセル内にグラフ表示 表のセル内に、数値だけでなく、棒グラフやヒートマップなどを表示することができます。 このビジュアライゼーションによって、問題点を迅速に特定し、データの傾向を直感的に捉えることが可能になります。 3-2.数値の表示桁数短縮 表のセル内に表示する数値の桁数が多い場合に、ワンタッチで短縮形表示に変更することが可能になります。これによって、表示スペースを節約して、表を読み易くできます。 4.SAS Mobile SDK iOS用SAS SDKおよびAndroid用SAS SDKを使用して、SAS Viyaサーバ上のコンテンツにアクセスするための強力なモバイルアプリを作成することが可能です。

Analytics | Artificial Intelligence
Mauricio González 0
Para ser inteligente, su empresa debe aprender primero

Para desarrollar nuestra inteligencia, los seres humanos tenemos que aprender. Comenzamos por percibir el entorno, perfeccionar nuestras capacidades de comunicación (hablar, leer, transmitir pensamientos abstractos) y absorber una gran cantidad de conocimientos a medida que crecemos. La máquinas y computadoras siguen un camino parecido. Para que Siri o Alexa, por

Data Visualization
Teri Patsilaras 0
Using Dynamic Text in a SAS Visual Analytics Report

You will not find an object in SAS Visual Analytics named Dynamic Text. Instead, you will find a Text object that allows you to insert dynamically driven data items. By using the Text object’s dynamic capabilities you can build custom report titles, object titles, emphasize measures and even supply the last modified time of the data source in your SAS Visual Analytics Report. In this post, I will outline the ways how you can leverage Dynamic Text in a SAS Visual Analytics Report.

1 2 3 9