You will not find an object in SAS Visual Analytics named Dynamic Text. Instead, you will find a Text object that allows you to insert dynamically driven data items. By using the Text object’s dynamic capabilities you can build custom report titles, object titles, emphasize measures and even supply the last modified time of the data source in your SAS Visual Analytics Report. In this post, I will outline the ways how you can leverage the Text object’s dynamic capabilities.
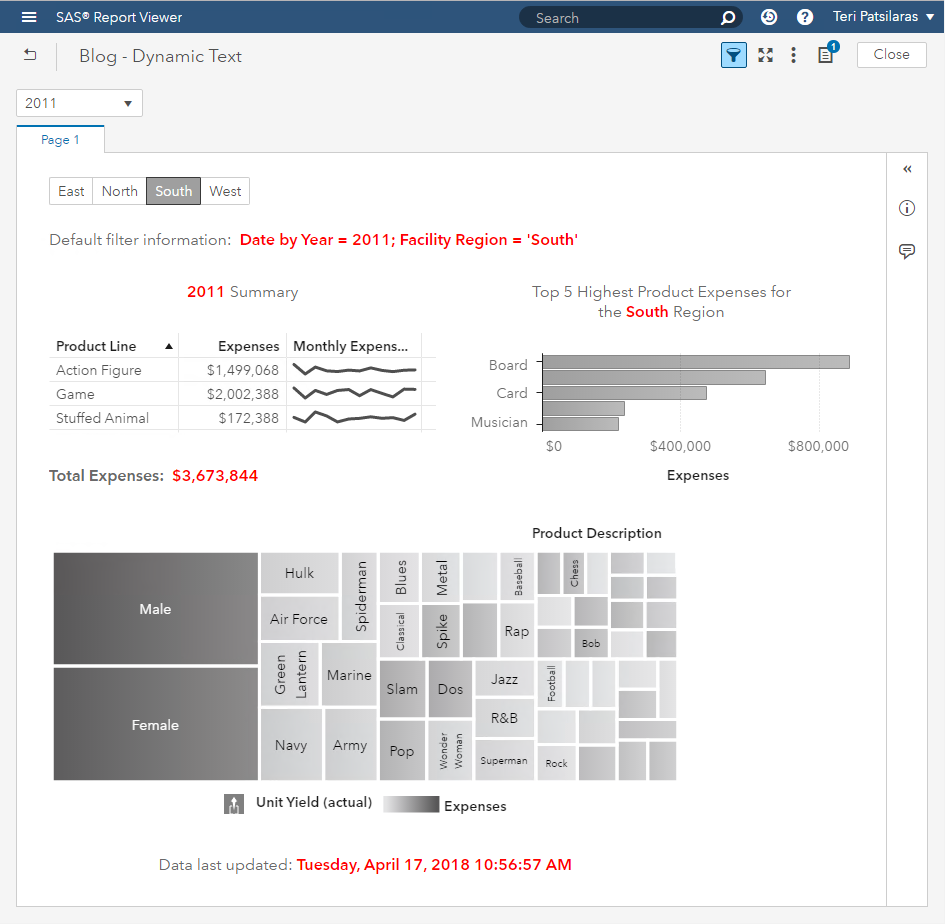
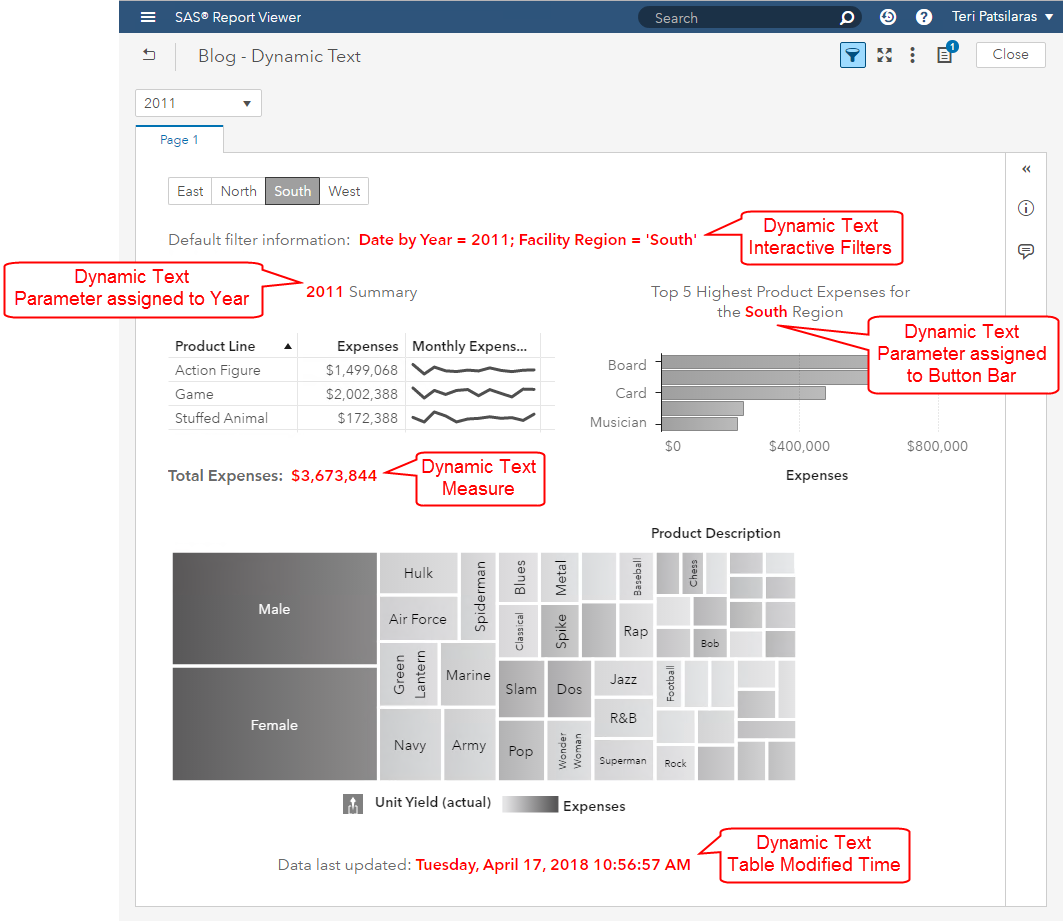
In this example report below, I have used a red font color to indicate the dynamically driven text.
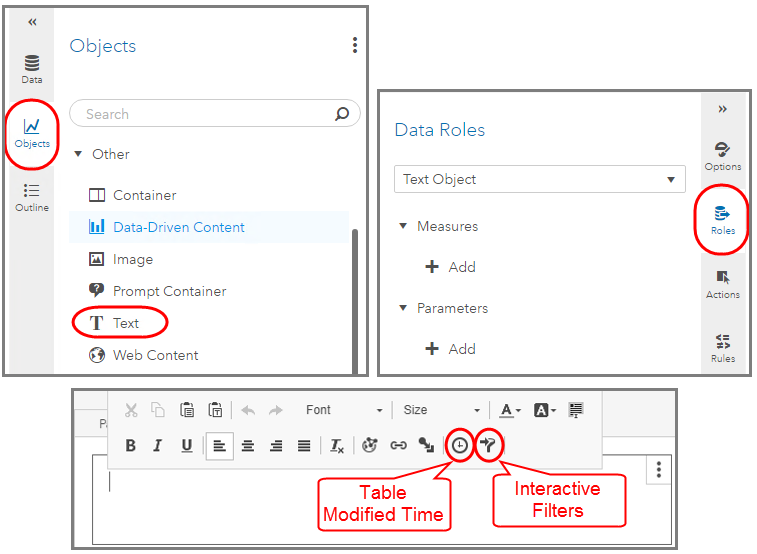
Let’s take a look the available dynamic roles in the Text object. You can see from the Objects pane that the Text object is grouped under Other.
From the Data pane we have the ability to add both Measure and Parameter data items. From the interactive editor of the Text object shown below, we also have the ability to insert the Table Modified Time and Interactive Filters.
The following sections will demonstrate how to configure each of these dynamically driven elements of the Text object.
Interactive Filters
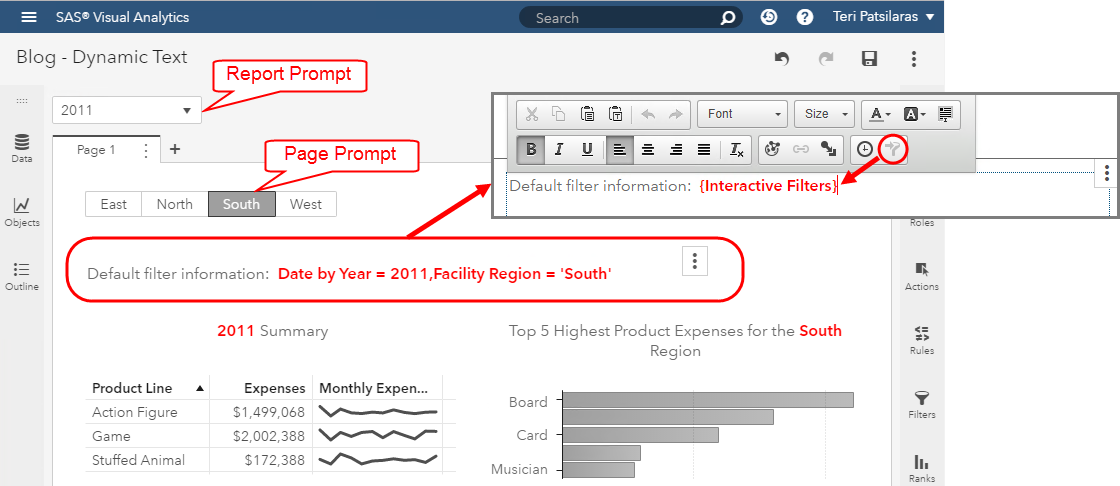
The out of the box display for Interactive Filters includes the selected values for control objects added to either the Report or Page Prompt areas.
To edit, be sure you are in Edit mode of Explore and Visualize. Click on the Text object to make it the active window and double click inside, then the interactive editor will open. Next, click on the Interactive Filters button. Use your cursor to position where you would like to add static text. In this case, I added the qualifier Default filter information:.
Multiple control object values are separated by a comma and also accommodates multi-value control objects.
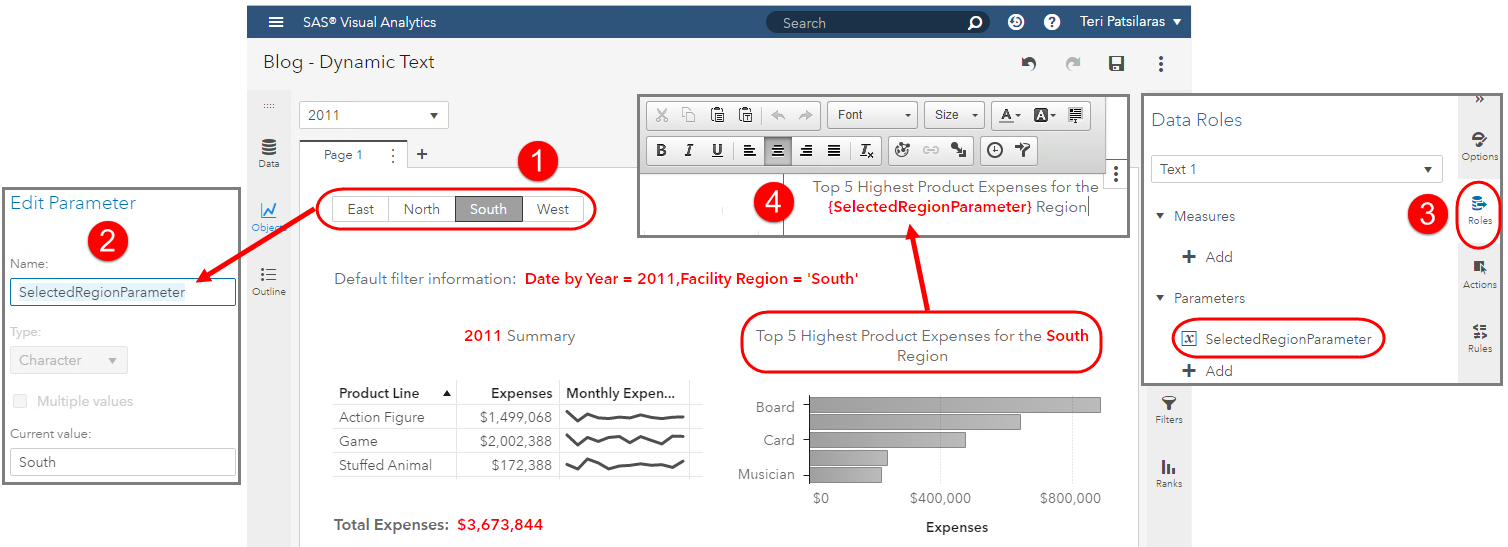
Parameters
While the Interactive Filter functionality is extremely useful, you may want to use prompt values more granularly to create custom report titles or even object titles. To do this, you must first create a parameter to hold the value selected in the control object, then use that parameter in the Text object.
In my example report, I have two prompts and two custom object titles leveraging parameters. Let’s look at each one individually.
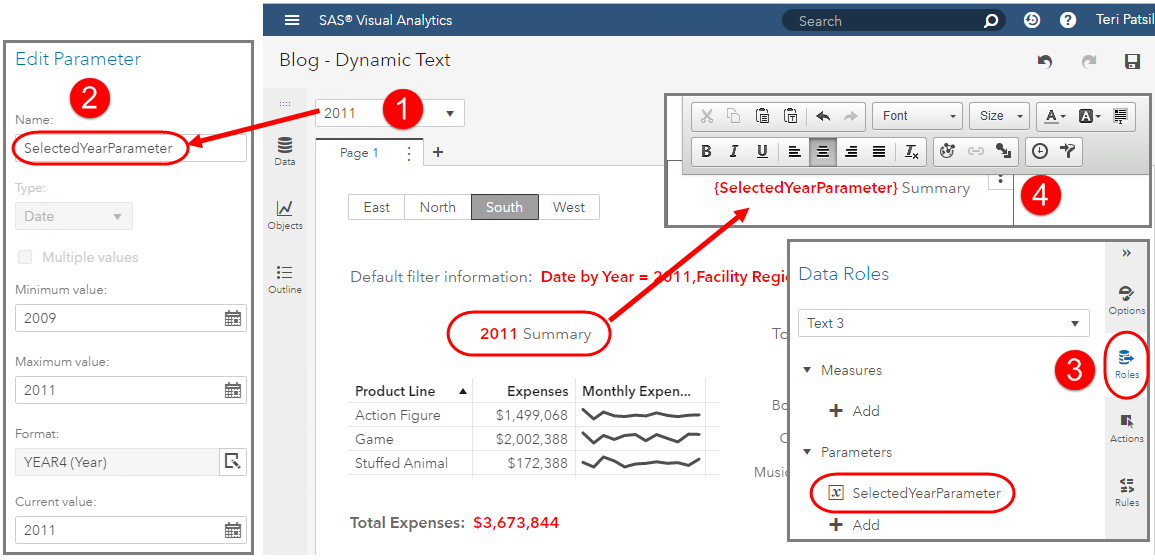
First is the Report Prompt, which prompts for year.
1. Create your prompt by using the Control object of your choice and assigning the desired data role.
2. Create a parameter that corresponds to the data type and assign it to the Control object’s Parameter Role.
3. For the Text object, assign the same parameter to the Text object’s Parameter Role.
4. Double click on the Text object, use your cursor to add static text as you like.
The steps are similar for the Page Prompt, which prompts for region.
1. Create your prompt by using the Control object of your choice and assigning the desired data role.
2. Create a parameter that corresponds to the data type and assign it to the Control object’s Parameter Role.
3. For the Text object, assign the same parameter to the Text object’s Parameter Role.
4. Double click on the Text object, use your cursor to add static text as you like.
Even though I demonstrate how to do this for both Report and Page Prompts, this same technique can be used for report canvas prompts. You just have to be sure you store the selected value(s) in a parameter that you can then use in the Text object’s Parameter Role.
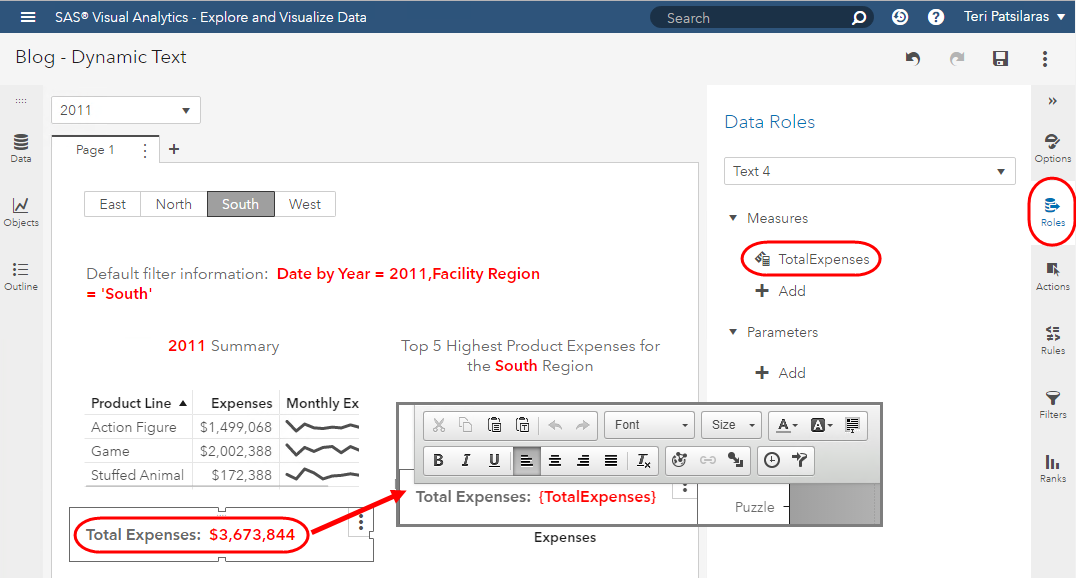
Measures
Very much the same way the Text object’s Roles are used to assign the Parameter values, we can do the same thing with a measure. This measure will be affected by any Report or Page Prompts automatically, but if you want to use a report canvas prompt you will need to create the Actions to the Text object appropriately.
Here you can see we are using the measure TotalExpense which is an aggregated measure of Expenses. Like in the previous examples, be sure to assign the measure to the Text object then double click to open the editor and use your cursor to add the static text.
The only applied filters for this aggregated measure are the selected year and region, therefore this Sum _ByGroup_ will return the Total Expenses for that Year and Region.
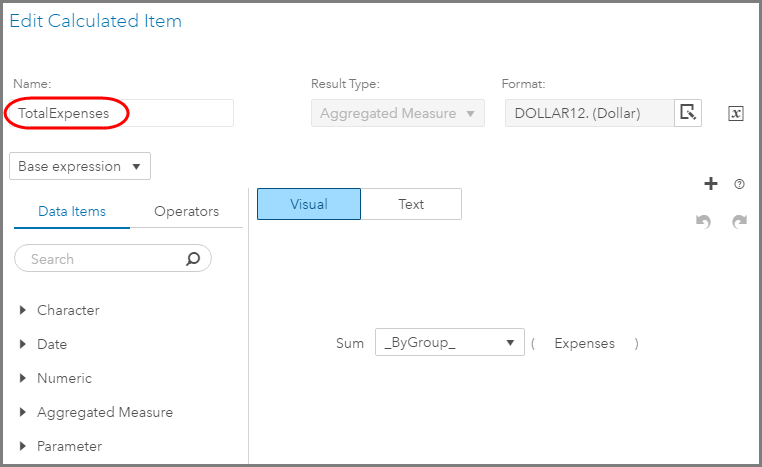
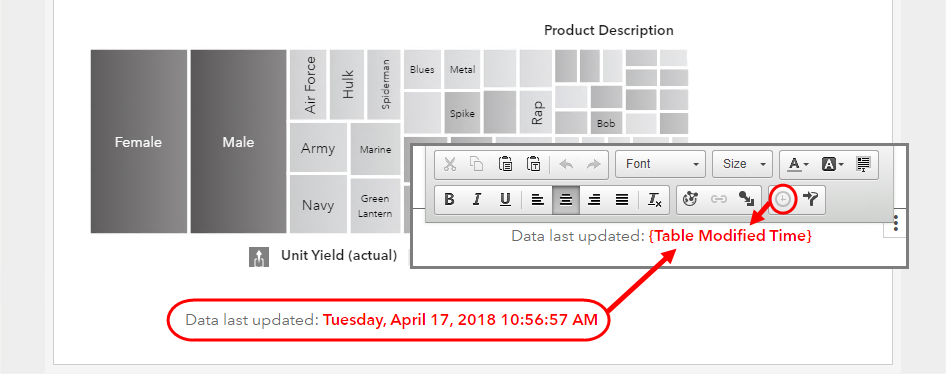
Table Modified Time
The last capability of dynamic text available in the Text object is the Table Modified Time.
The out of the box display uses the fully qualified datetime stamp and cannot be altered to a different format. To edit, double click inside the Text object and the editor will open. Then click on the Table Modified Time button. Next, use your cursor to position where you would like to add static text. In this case, I added the qualifier Data last updated:.
Conclusion
There are two main takeaways from this blog post. First is that you can easily build dynamic customizable titles, emphasize measures or parameter values.
Second, look to use the Text object for your dynamic text needs.
Here is a quick mapping as a review of what was detailed in the steps above.

10 Comments
Hi, very helpful article, thank you very much.
Hello,
Is there a way to add commentary for a weekly report on SAS Viya 3.5?
Hi Sridhar,
Take a look at the Report Summary feature and see if that can help with your requirement: SAS Visual Analytics Report Summary, what kind of beast is this?
Let me know if you have any questions.
Thank you,
Teri
Teri Patsilaras
One of the people who knows the most about VA, I have always used to strengthen my knowledge. Congratulations for being so clear on explanations.
Table Modified Time works for which data source?
Hoe can we specify the update time for various data sources / more than 1 data source in the same report?
Hi Sridhar,
The Text object is like any other object and can only have one data source support role assignment. Therefore, if you have more than one data source and you would like to see each of their table modified times, then you must add a dedicated Text object for each data source. The easiest way is to activate the first data source then add the Text object and insert the Table Modified Time. Then go back and add the static text for which data source it represents. Then activate the next data source, add a new Text object and insert the Table Modified Time - adding the static text for which data source it represents. When I say "activate" the data source, I mean to use the Data pane and make sure the data pane is display the data source you wish to feed the Text object.
Let me know if you have additional questions.
Thank you,
Teri
Awesome
I also wonder how to include those lines of monthly expenses in the table?
Hi Oystein,
The trend line in the List Table is called a Sparkline. See the SAS documentation here for more information on how to configure.
Thank you,
Teri
Hi,
Which version of SAS VA are you using. I don't think this works with version 7.3
Hi Aroop,
You are correct - the Dynamic Text feature was introduced in VA 7.4. So versions of Visual Analytics 7.4 and higher will support these dynamic text capabilities.
Thank you,
Teri